Is Your Next Location a Goldmine? How to research new location for business in 2026
The second site opens. The line forms slowly. Then… stalls. Staff stands idle. Rent doesn’t. That is how expansion fails: not with a grand mistake, but with a hundred small mismatches between your first location and the next. The fix is simple to describe and hard to skip under pressure: research new location for business decisions as seriously as you’d research a product launch. For a second site to work, your insights about local demographics, competition, and on‑the‑ground dynamics must lead the decision, not follow it.
Your first location succeeded for specific reasons: the income mix in a 10‑minute drive, the age profile of nearby households, the parking setup and curb cuts that make right turns easy, a competitor’s blind spot you quietly exploited. Before opening a second location, confirm those same conditions exist where you’re headed. Plan a two‑ to three‑month window to gather data: pull census profiles for population, age, and income; count competitors on Google Maps and by walking the block; observe foot traffic at multiple times; talk to neighbouring owners; verify zoning and lease terms; and only then compare the new area to your current winner. That discipline turns risk into judgment.
Related: How to Do Local Keyword Research for Your Small Business — Ahrefs
Understanding Local Differences
Success does not travel intact. A bakery that thrives in a family‑dense suburb can wither downtown where daytime workers want fast handheld items, not weekend cakes. A repair shop that benefits from a nearby highway ramp may suffer on a pretty high street where parking is scarce and loading bays are policed. The logic is straightforward: customer mix, trip purpose, and competitor density shift across neighbourhoods, even inside the same city. What worked on one corner can wobble five blocks away.
Start by mapping the specific factors that made your first site hum. List the three customer segments that deliver most revenue, the trip triggers that bring them in (commute, school pickup, late‑night dining), and the friction that blocks them (left‑turn access, confusing parking, safety at night). Then check whether those conditions are present in the candidate area. Local differences compound. A slightly older demographic plus a narrower sidewalk plus one stronger rival can bend your sales curve by double digits. It isn’t a marketing problem. It’s a math problem.
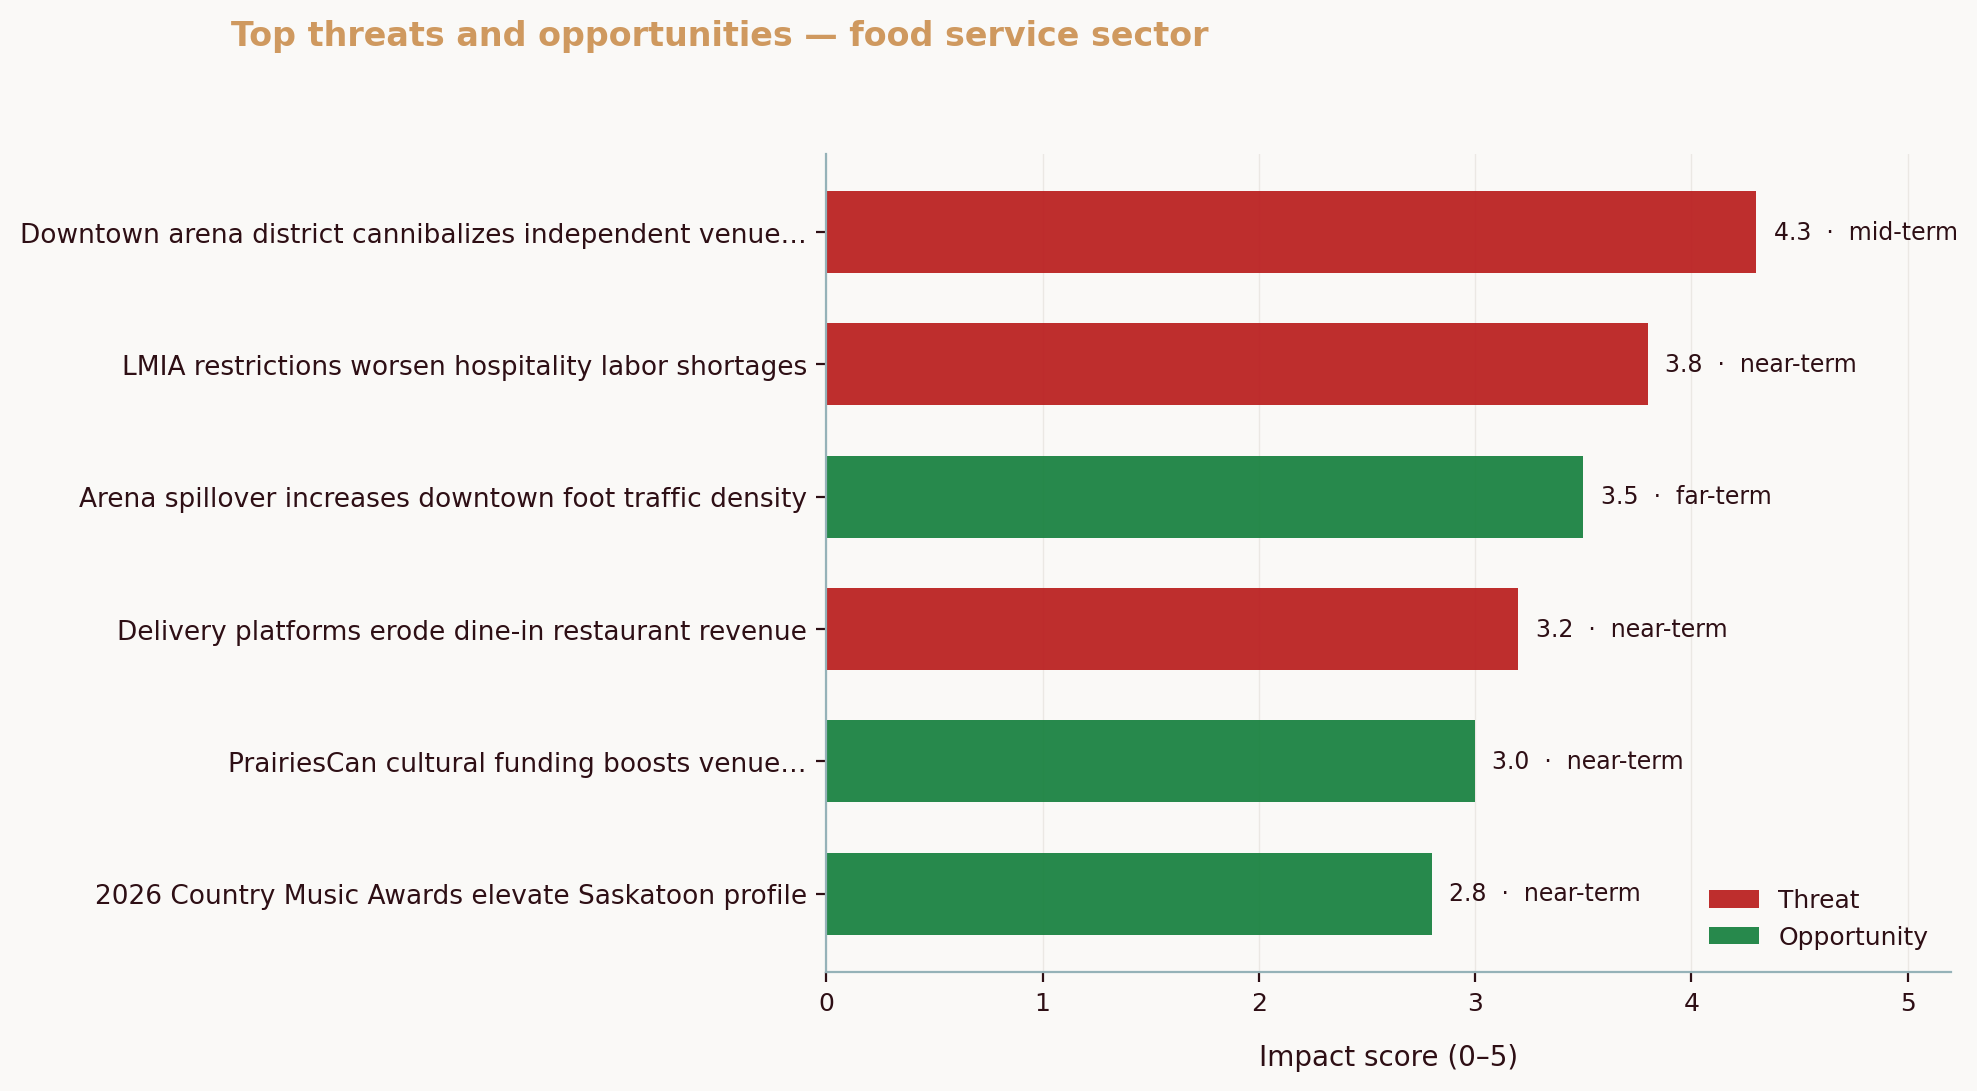
Here’s why localized research beats assumptions. Across anonymized Canadian SMB analyses via the Aurevon Intelligence Service, two patterns stood out in early 2026: in Calgary metal fabrication, a wall of near‑perfect review scores shifted competition away from “quality” toward “who shows up visibly, signals local supply chains, and demonstrates tech adoption such as CNC and welding robotics”; in Vancouver athletic wear, a retailer’s social‑share dominance eroded as JD Sports and Decathlon grew nearby and premium‑price pushback intensified through influencer channels. Local realities, not generic playbooks, decided the next move. (Aurevon Intelligence Service analysis, Canadian manufacturing SMB, March 2026; Canadian retail SMB, March 2026.)
What does this mean for you? Treat a second location like a fresh market. You’re not copying a store. You’re copying a system of choices that only works when the surrounding ecosystem cooperates. Think of it like sending two salespeople to pitch the same client: the one who speaks the client’s language wins. Local research, including disciplined market assessment, is how you learn the dialect.
With the stakes clear, shift from “why local differences matter” to “how to measure them quickly and well” using practical site selection habits.
Conducting Demographic Research
Demographics are the backbone of your expansion math because they define who will walk past, drive past, or live near your doors. In Canada, start with Statistics Canada’s 2021 Census Profile. It gives you population size, age distribution, household composition, language, and income for any census subdivision or neighbourhood profile. Note that income in the 2021 Census references the 2020 tax year, so adjust your expectations for recent inflation and wage shifts. Pull the same profile for your current location to enable a like‑for‑like comparison. This is your baseline for demographic analysis using official Statistics Canada Census tables. Census Profile, 2021, Statistics Canada. (www12.statcan.gc.ca)
Translate those tables into customers, not just numbers. If your core buyers are 25–44 with household incomes above the city median, check whether the new area hits similar thresholds. If your service skews toward seniors, look at the 65+ share, car ownership proxies, and transit access. Lifestyle matters too: apartments vs. single‑family homes affect storage, delivery, and parking needs. See the difference?
Then add business density. Statistics Canada’s Canadian Business Counts (June 2025) shows active firms by NAICS code at the CMA and CSD level. That lets you compare, for example, “How many bakeries, cafes, and grocery stores operate within the CMA and this specific suburb?” It’s not a full competitor list, but it frames saturation before shoe‑leather research. Canadian Business Counts, June 2025, Statistics Canada; see also The Daily explainer to interpret changes. The Daily: Canadian business counts, June 2025. (www150.statcan.gc.ca)
Layer in practical reconnaissance. Use a 10‑minute drive‑time or walk‑shed to approximate your trade area. Visit during school drop‑off, lunch, and evening. Count strollers and delivery backpacks. Note where people pause, what they carry, and which storefronts spill customers into the street. Keep a simple tally in your phone: 15‑minute intervals, rough counts by segment (families, students, commuters, tourists). The goal isn’t statistical perfection; it’s a grounded feel you can compare with census and business counts. As you refine your trade area analysis, use forward sortation area clusters from Canada Post to outline postal code pockets for direct mail, delivery radius, and service coverage.
Finally, pressure‑test assumptions with a quick phone‑bank. Call three local residences or associations: a property manager, a community centre, and a Business Improvement Area office. Ask about seasonal events, construction plans, and parking rule changes. A single “Oh, the street closes for festivals every other weekend” can flip your ramp‑up plan.
Curious how this folds into competitor research? It sets the baseline. Now you know who lives and works nearby; you can judge whether local rivals speak to those people better than you do.
Analyzing Competition
Competitors are not just whoever sells your product. They’re whoever steals your trip purpose. A dessert shop competes with movie tickets on Friday night. A running‑shoe boutique competes with gym memberships if budgets are tight. The task is to find the real set in that neighbourhood, not the imaginary list in your head.
Start with a Google Maps sweep using your category terms, then broaden to substitutes (for a cafe: bakery, bubble tea, patisserie, co‑working near coffee). Plot pins, then walk it. Talk to owners two doors down from each rival. Read the last 30 reviews, sorted by “newest,” to catch current strengths and stumbles. Note pricing, promotions, bundles, and channel mix (delivery, curbside, events). If you need a field guide for this legwork, see how to identify your real competitors and use a light SWOT from this small‑business template. To watch how rivals discount or message seasonally without paid tools, this walkthrough on tracking competitor pricing and marketing is practical.
Now score local saturation and the gap you could fill. If reviews cluster near five stars across the board (a pattern we saw in the Calgary metal‑fabrication market noted earlier), then “quality” isn’t the differentiator. Visibility, local sourcing, speed, or tech‑forward proof points might be. If a major entrant is expanding nearby, like the Vancouver athletic‑wear case, prepare a stance on premium pricing and brand story that meets that pressure head‑on, not with generic slogans.
Here’s a sample comparison table you can adapt after fieldwork:
| Competitor Name | Location | Strengths | Weaknesses | Market Share |
|---|---|---|---|---|
| Riverfront Fitness | Downtown East | Aggressive class schedule; influencer ties | Limited parking; higher drop‑in fees | Est. 15–20% |
| Westside Athletics | West 4th Ave | Strong community events; loyalty perks | Narrow size range; slower special orders | Est. 10–15% |
| Budget Sports Outlet | Metrotown | Sharp pricing; heavy promo calendar | Thin staff training; inconsistent service | Est. 20–25% |
| Local Run Co. | Commercial Dr. | Expert fittings; club runs | Small inventory; closed Mondays | Est. 8–12% |
Use “Market Share” as a directional proxy from footfall observations, review velocity, and visible class or checkout volume. Update it once you have POS comps from friendly landlords or a week of in‑person counts.
Side‑by‑side your current and candidate areas to sharpen the call:
| Factor | Current Location | Candidate Area |
|---|---|---|
| Population (10‑min drive) | [Your data] | [Your data] |
| Median Household Income | [Your data] | [Your data] |
| Age 25–44 Share | [Your data] | [Your data] |
| Daytime Worker Density | [Your data] | [Your data] |
| Competitor Count (1 km) | [Your data] | [Your data] |
| Avg. Review Score (Top 5 Rivals) | [Your data] | [Your data] |
| Typical Lease Rate (psf) | [Your data] | [Your data] |
| Parking/Access Notes | [Your notes] | [Your notes] |
| Delivery/Loading Access | [Your notes] | [Your notes] |
| Seasonal Swings | [Your notes] | [Your notes] |
The grid exposes mismatches fast. If your first store thrives on school‑adjacent afternoon rushes and the candidate area skews toward late‑night entertainment, either adapt the offer or choose a different block.
With a view of rivals and fit, you’re ready to translate site appeal into numbers.
Evaluating Financial Implications
Before you fall in love with a storefront, price it like a CFO. Start with base rent and additional rent (common area maintenance, taxes, insurance). Ask for historical statements for the last two years to see variability. Confirm the rent escalator and any “go‑dark” or co‑tenancy clauses in the centre. Renovation costs should include permitting, drawings, trade availability, and contingency. If you sell food, ventilation and grease management can turn a “cheap” site into a budget crater.
Two macro forces shape costs this cycle. First, Canada’s retail real‑estate market has been supply‑constrained, with retailers expanding into secondary markets and adapting store formats as availability stays tight. Tight supply can keep rents firm in high‑traffic corridors even when sales slow, so test margins under less‑than‑ideal comps. Canada Real Estate Market Outlook 2025, CBRE; see the retail section on constrained supply and expansion into secondary markets. (cbre.com) Second, many SMEs report rent as a mounting burden. CFIB’s research flagged steep commercial rent hikes and the share of small firms facing increases, a pressure that compounds when interest rates hold steady instead of falling. In Focus: Commercial rents see steep hikes, CFIB. (cfib-fcei.ca)
To get from “numbers on a page” to “viable plan,” build a site‑specific P&L with three scenarios: base case (conservative), upside (best realistic), and downside (slow ramp, 15–20% less footfall than hoped). Tie each to explicit assumptions: visits per day by part of week, average ticket, conversion rate, and hours staffed. Add recurring costs that second sites magnify: cross‑location management time, extra accounting, delivery and inter‑store transfers, and duplicate software seats. Reserve for working capital; a second store usually demands more cash float than you expect in month two and three. This turns a market assessment into a grounded operating plan.
Hidden gotchas to check early:
- Municipal zoning and permitted use categories, plus any caps on patio seating, signage, or late‑night hours. Municipal bylaws can constrain your format more than your lease does.
- Parking ratios and delivery access. A gorgeous corner with no loading bay can strangle your morning prep and frustrate ride‑share pickup.
- Seasonality and events. Streets that close for festivals can be a gift or a two‑day shutdown depending on your category.
- Build‑out lead times. Trades can be booked out. A six‑week plan can stretch to twelve if you don’t lock contractors early.
💡 Pro Tip
Create a line‑by‑line budget before you negotiate. Include base and additional rent, legal fees, design, permits, build‑out, equipment, security deposit, utilities setup, signage, contingency, plus two months of payroll and inventory. A detailed budget reveals where to push for landlord concessions and what you can’t afford to compromise.
Want a practical anchor? Here’s a fast before/after you can run this week.
Before: a single spreadsheet with one “rent” number and a sales guess.
After: a site P&L with a 13‑week cash flow, three traffic scenarios, and a staffing plan that flexes by hour. That shift turns a landlord’s quote into a negotiable deal structure.
Once the math holds, you still need a call. Should you go now, wait, or test lighter?
Making an Informed Decision
Treat the decision like a fork with three clean paths. Each path has criteria and a next action.
1) Go
Choose “go” when the demographic match is strong, two or more clear differentiation angles exist, and the site P&L shows break‑even within your acceptable window. Signs you’re there: your side‑by‑side grid shows equal or better income and age fit, your competitor table reveals a gap you can credibly fill, and your foot‑traffic checks confirm the dayparts you rely on. Your next move is to lock legal review, negotiate build‑out timing, and set a 90‑day opening plan that includes a ramp metric by week.
2) Wait
Choose “wait” when one variable is fuzzy but fixable. Maybe a construction project nearby will clear in six months, or a landlord is open to a right of first refusal on a better unit. Waiting is different from stalling. While you wait, build demand: expand delivery into the new area, run targeted SEO and local content, and pilot menu or product variants tailored to that neighbourhood’s preferences.
3) Try a lighter approach first
Pop‑ups, short‑term licenses, partnerships, and mobile formats reduce risk and produce data. A three‑weekend pop‑up near the target block can validate price points and peak hours. A delivery‑only zone test shows whether conversion holds without footfall. A partnership with a local business (coffee inside a bookstore, juice bar in a gym lobby) lets you sample the traffic without a full lease. If you need a quick primer on scoping actual rivals before a pop‑up, revisit the field guide on finding real competitors and keep your notebook handy.
Decision rhythm matters. Set a simple framework that forces clarity:
- Fit: Does the target area’s age, income, and trip purpose match your best customers? Back this with pulled census tables and your observation notes. BDC’s site‑selection guide includes a practical checklist of building and zoning criteria to add to your evaluation. (bdc.ca)
- Gap: Is there a real opening, not just room on the map? Your competitor table should show how you’ll win a trip purpose, not merely join the chorus.
- Math: Do three scenarios keep you solvent and sane? Rents, wages, and working capital must clear. If your analysis relies on perfect days, the site isn’t ready.
What does this actually look like in action? Imagine a Halifax accounting firm choosing between a core‑downtown space and a suburban strip with simpler access. The downtown option wins on brand perception; the strip wins on parking and rent. Demographics show more small businesses in the downtown walk‑shed, but foot‑traffic observation reveals heavy lunch peaks and quiet mornings. A four‑week pop‑up “tax clinic” downtown quantifies whether short consultations convert to ongoing plans. If conversion lags, the firm chooses the strip and schedules monthly downtown office hours to keep face time with core clients.
Do this today: pick one candidate area and open its 2021 Census Profile in a browser tab. Jot five metrics that define your core buyer (population, median income, 25–44 share, language, households with kids). Then open Google Maps, list the top five direct and substitute competitors, and schedule two site visits this week at different dayparts. That two‑hour sprint kick‑starts the research habit you’ll need for a confident yes or a disciplined no.
If you want to go deeper on competitive technique, two primers can help you structure the work: a field guide to identifying real competitors, and a fast SWOT template for small business rivals. For ongoing monitoring without expensive software, save this walkthrough on tracking competitor pricing and marketing. For bigger‑picture thinking on how small firms out‑decide larger ones, this piece on beating bigger competitors with data is a sharp refresher, and if you’re packaging research into a decision brief, here’s a practical explainer on getting a competitive intelligence report.
Common Questions About Researching New Locations
What specific demographic data should I focus on?
Prioritize the variables that correlate with your sales: age bands tied to your best buyers, median household income relative to your average ticket, household composition (e.g., families with children if you sell kid‑oriented products), and language if it affects signage or service. Pull the 2021 Census Profile for both your current and candidate areas so you can compare like with like, and remember that income reported there reflects the 2020 tax year. Statistics Canada Census Profile (2021). (www12.statcan.gc.ca)
How can I effectively assess local competition?
Use a layered approach. Start online with Google Maps and category terms to define the initial set, then add substitutes that steal the same trip purpose. Read the newest reviews to catch current strengths and gaps. Walk the area twice on different days to observe pricing, promotions, service, and foot‑traffic patterns. Capture findings in a table so you can see which rival you beat on which dimension. For a structured method, review the field guide on identifying real competitors and pair it with a quick SWOT from this template.
What are the common hidden costs when opening a new location?
Beyond base rent and build‑out, plan for permitting delays, professional fees, signage approvals, security deposits, utility hook‑ups, waste management, and insurance increases. Add line items for cross‑location management time and inventory transfers. SME surveys and market outlooks point to tight retail availability in many corridors, which can keep rents firm even when the economy cools, so carry a stronger contingency. Canada Real Estate Market Outlook 2025, Retail section, CBRE; CFIB: Commercial rent pressures. (cbre.com)
Is it advisable to try a pop‑up before committing to a new location?
Yes. A short‑term pop‑up or partnership is a low‑risk way to measure interest, price tolerance, and peak hours. Treat it as a miniature site selection study: collect daily foot‑traffic counts, record conversion by time block, and test your bundle or menu. If results reach your base‑case assumptions, you have proof. If they don’t, you’ve bought clarity cheaply and can refine offer, hours, or block choice without signing a full lease. BDC’s location checklist is a helpful companion for turning pop‑up learnings into criteria for the permanent lease. BDC: Choosing the right location. (bdc.ca)
How do I choose a location for a second business?
Use a simple fit‑gap‑math lens. Fit comes from demographic analysis and trade area analysis that mirrors your best customers. Gap comes from competitor tables that show a trip purpose you can win. Math comes from a site P&L with conservative, upside, and downside scenarios. Layer these into a short list of site selection criteria, then validate with on‑the‑ground visits and a timed pop‑up if needed. The BDC checklist linked above is a useful cross‑check.
How much foot traffic does a location need?
Work backward from break‑even. Required daily visits = target daily sales divided by (average ticket times conversion rate). Example: if break‑even sales are $1,800 per day, your average ticket is $30, and conversion is 35%, you need roughly 171 visitors daily. Track by daypart, not just totals, since staffing and product mix depend on when that traffic shows up.
A final note for owners comparing sites right now: if the math works, momentum matters. Pencil the plan, gather permission, and move with intent. If it doesn’t, be proud you learned before you signed.
Aurevon’s Ecosystem Dynamics Report distills local demographics, competitor moves, and neighborhood dynamics into a concise brief you can use to green‑light a site or hit pause. If you’re evaluating a second location and want a faster way to see the full picture, learn more about the Ecosystem Dynamics Report and decide if it fits your process.
Mitchell Ozmun
SMB Researcher, Business Analyst - Saskatchewan Born and Raised