How to Get a Competitive Intelligence Report for Your Business
Sixty-five percent of B2B sales opportunities are outright competitive. Your prospect compares you side by side, and the winner is the team with better facts, faster interpretation, and a clearer story. That’s why a competitive intelligence report for business isn’t a “nice-to-have”; it’s the briefing you bring to every high‑stakes decision. Today, you can even generate an automated snapshot in under a minute with no meetings or waiting, then refine it into a strategic asset your leadership can act on.
If you’re overwhelmed by fragmented data, here’s the relief: a structured report focuses attention, filters noise, and turns scattered signals into a plan. Think of it like a flight plan for your next quarter—route chosen, fuel calculated, alternates set. You’re not guessing. You’re navigating.
Related: AI Tools for Small Business - 7 Ways Small Business Can Use AI Today — Philip VanDusen
Introduction to Competitive Intelligence
Competitive intelligence (CI) is the disciplined practice of collecting and interpreting information about your market, customers, and rivals to improve decisions. It’s not spying. It’s systematic research drawn from legal, public sources such as websites, reviews, filings, job posts, pricing pages, and social chatter. Why the urgency now? Because buying behavior keeps shifting, and it’s visible in the data. Statistics Canada reports that Canadians changed grocery shopping habits as inflation eased, proof that consumer preferences can swing even when headline pressure cools. If your intel cycles lag, your positioning will, too. Source.
Here’s the surprising part: small and mid‑sized firms gain as much from CI as large enterprises. SMEs employ roughly 63% of Canada’s private‑sector workforce, so sharper decisions at smaller companies ripple through local economies. When SMEs use CI to choose segments, refine pricing, or time promotions, the impact isn’t theoretical—it shows up in payrolls and pipelines. Key Small Business Statistics 2025.
The stakes are personal. In PwC’s 2024 Pulse Survey, a third of CEOs think the average competitor in their industry will disappear within three years without a business‑model shift. Translation: assume the ground will move under you, then build an intelligence rhythm that spots shifts early. Source. If 65% of your opportunities are competitive, showing up without a current briefing is like sending two salespeople to pitch the same client and letting the other team bring the only deck. One has proof. One has hunches. Guess who wins.
With context set, let’s build the competitive intelligence report for business that guides your next move.
Components of a Competitive Intelligence Report
A strong report is modular. Each module answers a real business question and can stand alone in a leadership meeting. Use these core components and map each one to a decision you need to make this quarter.
- Market overview: What’s growing, slowing, or fragmenting? Include TAM/SAM notes, regulatory watch, and demand signals.
- Competitor profiles: Who truly overlaps with your audience and use cases? If you’re unsure, start with this field guide on identifying real competitors.
- Positioning and messaging scan: How rivals frame value, proof points, and objections.
- Product/offer matrix: Feature breadth, depth, pricing tiers, and packaging.
- Distribution and channel strategy: Where they sell and how.
- SWOT: Your strengths, weaknesses, opportunities, and threats versus named rivals. Use this competitor SWOT template to speed it up.
- Trigger events and watchlist: What changes must prompt action within 48 hours?
Here’s a quick comparison to keep your build organized.
| Component | Description | Importance |
|---|---|---|
| Market overview | Demand, regulation, macro signals | Anchors strategy to reality |
| Competitor profiles | Head‑to‑head snapshots, proof points | Shortens sales prep and PMM work |
| Positioning scan | Messaging themes and claims | Informs copy, pitch, and objections |
| Offer matrix | Features, pricing, packaging | Guides pricing and bundling moves |
| Channels | Direct, partners, marketplaces | Reveals reach and CAC dynamics |
| SWOT | Internal vs external factors | Prioritizes where to attack or defend |
| Watchlist | Events requiring a response | Drives speed and accountability |
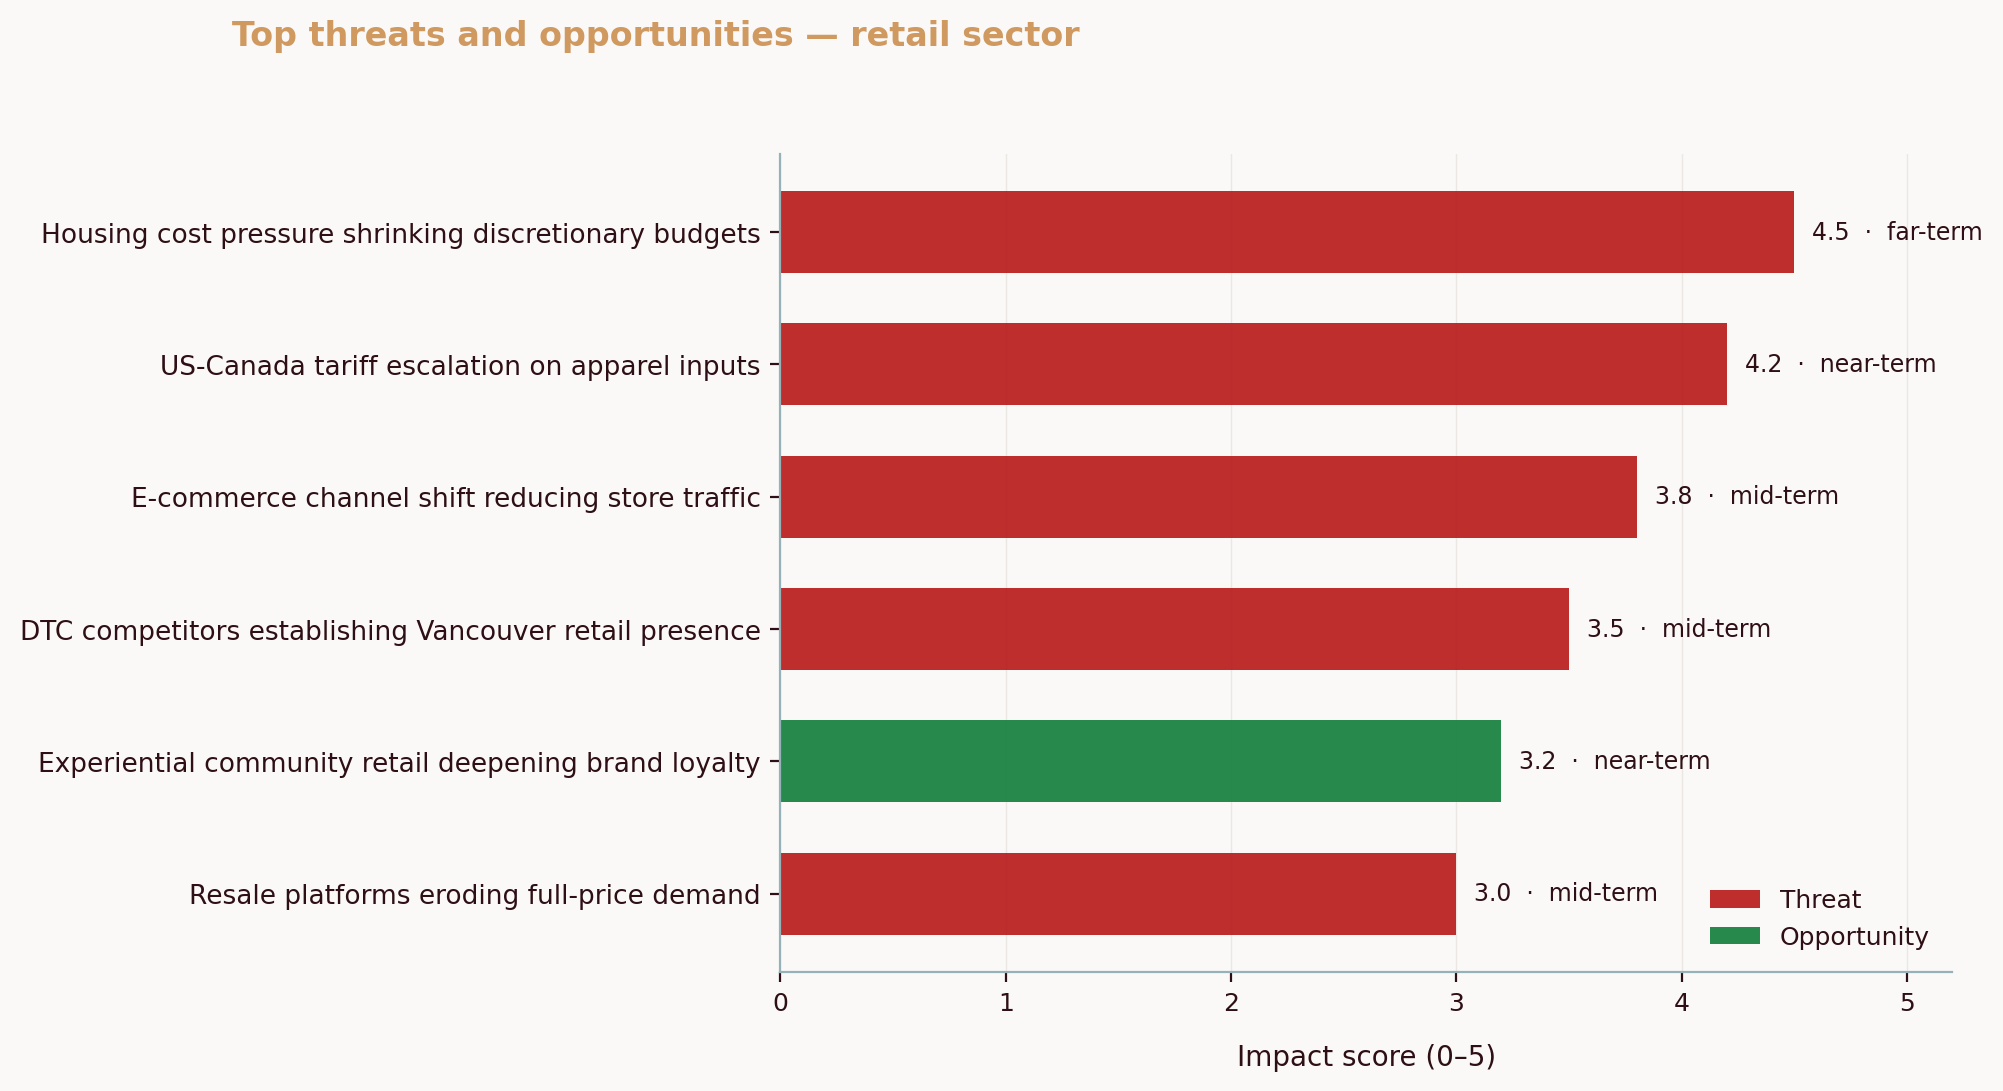
Proprietary signal check: in March 2026 analyses via the Aurevon Intelligence Service, three Canadian SMBs surfaced patterns worth building into your report modules. A Calgary custom metal fabricator faced a market crowded with near‑perfect review scores, shifting competition from “quality” to “who’s visible, local, and tech‑forward” (think CNC and welding robotics). A Vancouver athletic‑wear retailer’s once‑dominant share of local social mentions eroded as JD Sports and Decathlon expanded and influencers pushed Vuori and Alo Yoga, while price pushback grew. A Saskatoon bar felt a triple squeeze of value, food‑safety assurance, and atmosphere, forcing tighter menu engineering and experiential upgrades. Those aren’t curiosities; they’re module drivers: revise positioning, refresh local SEO and content cadence, and set watchlists for supply‑chain localization and price elasticity.
Bridge to what’s next: Components are only useful if they’re fed by trustworthy inputs. So how do you collect them efficiently?
Methods for Gathering Data
Start with a clear intake: Which decisions must the report support in the next 90 days? Hiring for a new territory? Adjusting price? Launching a bundle? Decisions clarify data needs.
Primary research adds texture you can’t scrape. Run quick interviews with recent buyers and lost deals. Ask where you won, where you fell short, and which alternatives were on the shortlist. In competitive intelligence, restaurants and bars should scan dining reviews by week and shift, demand varies by game nights and family hours. Secondary research scales breadth: websites, product changelogs, job posts, pricing pages, review sites, search results, app store comments, social posts, and local business directories. Use Google Maps to map local density and proximity, then verify opening hours, menus, and service areas. If you work with owners or local lenders, BDC resources are useful for framing assumptions and risk.
Service businesses analyze competitors by mystery‑shop calls, response‑time tests, quote clarity checks, and follow‑up quality. Retail small businesses doing competitive intelligence can track shelf price changes, local foot‑traffic drivers, influencer mentions, and review velocity across neighborhoods.
Tools help, but keep them honest. Some platforms track website traffic, keyword shifts, or ad creatives; others watch pricing changes and SKU availability. A simple stack does the job: a site‑change monitor for competitor pages, a social‑listening feed for brand and category terms, a spreadsheet to log changes and your responses, and a shared “intel updates” channel for the team. If you plan to track competitor pricing and marketing, calendar a weekly 30‑minute scan and assign a rotating owner.
Ethics matter. Only use public information, respect terms of service, and avoid scraping personal data. If you’d be embarrassed to explain the method to a customer or regulator, don’t use it. One more guardrail: document sources. You’ll thank yourself when a skeptical CFO asks, “Where did that number come from?”
Question to keep you honest: Will this data change a decision? If the answer is no, cut it. Noise kills speed.
Analyzing and Interpreting Data
Raw inputs don’t move revenue. Interpretation does. Use lightweight frameworks that force choices:
- SWOT for side‑by‑side clarity on where you can credibly win now.
- Five Forces to understand where margin pressure will hit next.
- Jobs‑to‑Be‑Done to map buyer outcomes to your feature and pricing choices.
- Trend–Driver–Implication (TDI) notes to translate headlines into moves.
- Win/loss themes to validate whether intel changes deals.
Add a “decision line” to every finding: What will we start, stop, or continue? Without that line, slides drift and action stalls. After a competitive analysis, shortlist three moves, assign owners, update frontline collateral like battlecards, and schedule a 30‑day check on results. CI leaders often update battlecards and similar assets quarterly, which pairs well with a 90‑day roadmap cadence. Source. The goal is to act on your competitive intelligence report, not admire it.
Here’s how this actually works. Imagine a Halifax accounting firm noticing new fixed‑fee packages at a rival. Before: confused scoping, hourly overages, and inconsistent close rates. After: a “profit‑guardrail” package with clearly stated inclusions, a comparison table in proposals, and a frontline script to defend value. Clarity in, friction out.
💡 Pro Tip
Use visuals to compress complexity. A two‑by‑two for price vs. feature depth, a timeline of competitor launches, or a stacked bar of review themes beats a wall of text. Your audience scans. Help them see the move.
| Technique | Tool | Use Case |
|---|---|---|
| Win/loss coding | Spreadsheet or Airtable | Distill 30+ interviews into 5 themes |
| Message mapping | Slides or Miro | Align pitch to category claims |
| Price corridor | Excel/Sheets | Set floors, fences, and trade‑ups |
| Launch timeline | Roadmap tool | Anticipate counter‑moves and seasonality |
| Sentiment clustering | BI tool (Power BI/Tableau) | Turn reviews/social into 3‑5 priorities |
| Network view | Gephi or similar | Map partner and influencer effects |
One opinion worth adopting: your analysis should read like an operations plan, not a white paper. Short sentences. Clear verbs. Owners and dates.
Ready to package it?
Creating and Presenting the Report
Build the report for how decisions are actually made in your company. Executives want a narrative, then exhibits. A practical flow looks like this:
1) Executive brief (one page). State the thesis, three implications, and the 30‑day actions.
2) Market and demand section. One chart, one paragraph.
3) Rival snapshots. Three to five profiles, each on one page. Link deeper docs. See the field guide on finding actual rivals.
4) Offer and pricing matrix. Include fences that justify step‑ups.
5) Go‑to‑market risks and counters.
6) Action register. Owners, dates, metrics.
Presentation tips: Use a single color for “our company,” keep charts consistent, and include source tags on every slide. If a metric is uncertain, flag its confidence level. You earn trust by separating signals from guesses.
Cadence matters. A quarterly refresh fits most SMBs because it matches planning cycles and sales seasons, and it aligns with how often CI managers say they update key assets like battlecards. Source. For high-velocity categories such as restaurants and retail small businesses, run a light monthly pass on reviews and local events.
Before/after to aim for:
Before: ad‑hoc screenshots, stale notes, and debate.
After: a versioned brief with three specific moves, a shared watchlist, and leaders who can defend trade‑offs in one meeting.
Do this today: schedule a 45‑minute working session to define your top three decisions for the next quarter, then assign which module will answer each one. No module without a decision.
Common Questions About Competitive Intelligence Reports
What is the purpose of a competitive intelligence report?
It aligns your team on where you can win, why, and what to do next. Think of it as the “single source of decision” that condenses market signals, competitor moves, and customer feedback into a short set of actions. In markets where 65% of deals are competitive, arriving with this brief improves sales prep, product trade‑offs, and budget timing. Source.
How often should I update my competitive intelligence report?
Quarterly is a practical rhythm for most SMBs, with lighter monthly updates if your category shifts faster. It pairs well with quarterly planning and keeps frontline enablement fresh without burning analyst time. For structured refreshes, revisit your SWOT at least annually using this competitor SWOT resource, then tighten watchlists every quarter.
What tools can I use for competitive intelligence?
Start simple. A site‑change monitor for competitor pages, a social‑listening feed for your category, a shared spreadsheet for the action register, and a BI dashboard for trend charts. Add depth as needed: keyword tools for search shifts, price trackers for SKUs, and review analytics for service quality. The tool is less important than the workflow that turns inputs into decisions you can act on.
Can small businesses benefit from competitive intelligence?
Absolutely. With SMEs responsible for most private‑sector employment in Canada, sharper decisions at small firms swing local outcomes. A concise report means the owner can adjust pricing, choose segments, or reprioritize marketing in days, not months. That agility is a real moat. Source.
Ready to turn this into an unfair advantage? For a fast, comprehensive starting point that covers competitors, industry trends, and local dynamics, consider the Aurevon Ecosystem Dynamics Report. What does an Aurevon report include? It typically provides competitor profiles, market trendlines, a local map of key players, pricing and offer scans, review themes, and a 30‑60‑90 day action register so you can make stronger moves sooner. One link. One report. Then action.
Mitchell Ozmun
SMB Researcher, Business Analyst - Saskatchewan Born and Raised