What Local Market Analysis Reveals for SMEs in 2026
Only 68% of new Canadian employer-enterprises born in 2021 were still active in 2023. That is a lot of shuttered signs, staff layoffs, and leases you can’t easily unwind. The gap between those who survive and those who thrive often comes down to one practice done well in the first mile: local market analysis. When you examine your specific geographic area with discipline (competition, customer mix, and economic currents), you make better calls on pricing, positioning, and growth. Miss it, and you guess. Guessing is expensive. Statistics Canada
Related: How SMART small business will market themselves in 2025 | Small business marketing — Jade Beason
Introduction to Your Local Market
Many owners treat this as a box to tick before a grand opening. It isn’t a formality. It is your operating map. A market study at the city, neighborhood, and trade-area level clarifies three realities that shape every decision: who is buying, who else they could buy from, and how money is moving through your local economy. Think of it like checking the depth, current, and weather before launching a boat. You still have to steer, but you now know which way the wind blows.
Start with the competitive picture. Your goal isn’t to list every rival; it’s to rank the few rivals that shape demand in your slice of town, then understand how they win. That means mapping direct substitutes (the other Pilates studio within 10 minutes), indirect substitutes (the gym with reformer classes), and attention stealers (the yoga class down the block with a waitlist). Who actually draws your ideal customer at 6 a.m. weekdays? That one matters more than the glossy studio across town.
Next, ground yourself in people, not personas. Pull the local demographics data business owners actually rely on: age bands by postal code, household income, languages spoken at home, renter versus owner mix, commute times. Then add behavior: reviews, social chatter, footfall by daypart, search patterns like “best daycare near me” versus “after-school programs.” Together, these reveal the why behind local spending. And keep a third lens open: economic indicators that shift demand up or down, such as financing costs, population inflows, or regulatory frictions that sap your time. The cost of red tape alone reached an estimated $51.5 billion in 2024, with the smallest firms paying the most per employee. Time lost to paperwork is time you don’t spend with customers. CFIB
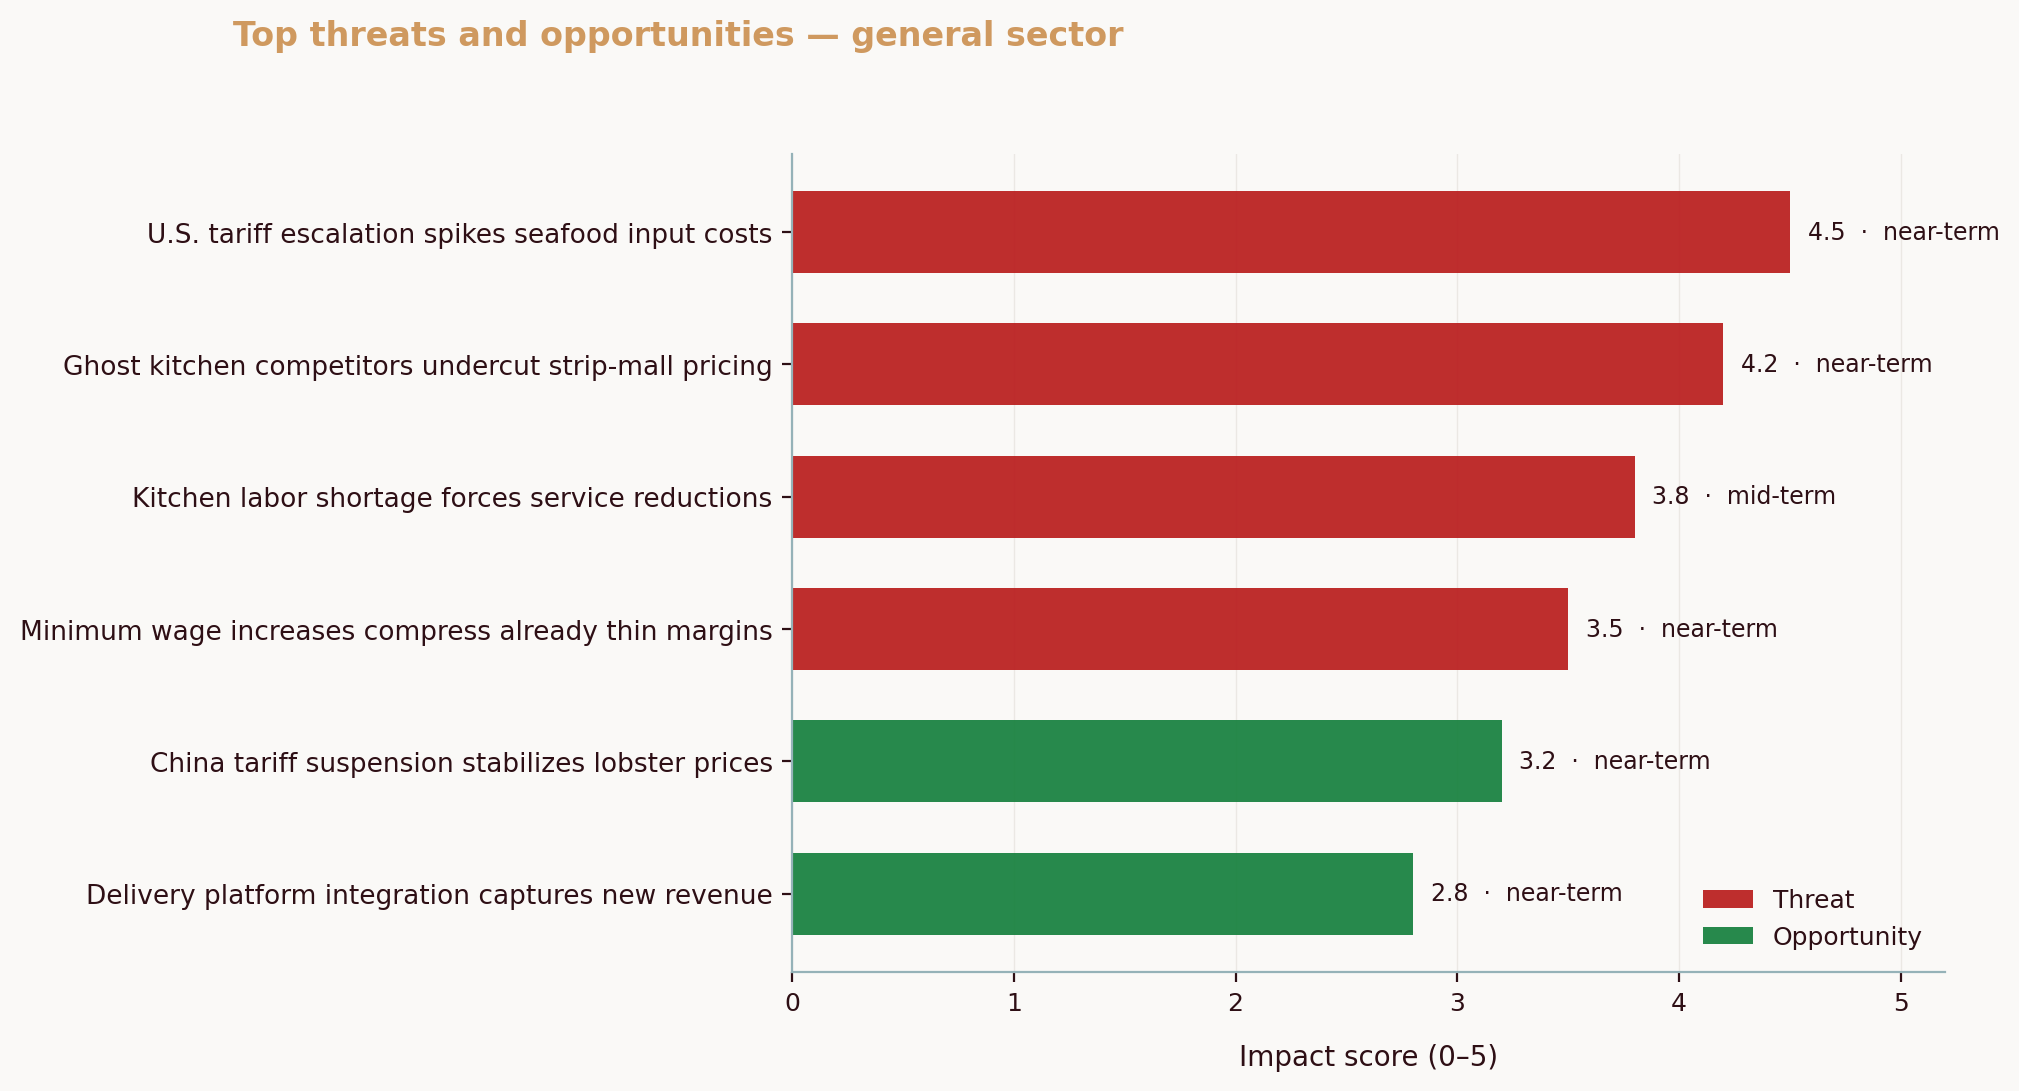
Here’s the thesis in plain terms: rigorous analysis of your immediate market is the shortest path to informed decisions. It spots opportunities a spreadsheet can’t guess, and it surfaces threats before they hit your P&L.
Key Components of Your Local Market
Demographics tell you who is in your trade area; psychographics explain why they choose; geography tells you where they move. Blend all three.
Start with the population you can reach within 8–12 minutes by car or 10–15 minutes on foot, depending on your category. Segment by age, household structure, and income, then overlay triggers that matter to your category. A dentist watches new family formation. A garden center watches homeownership and townhome completions. If you run a service business, segment daypart availability and commute patterns. It is common to stop here. Don’t. Layer psychographics from reviews and social posts: values (local sourcing), friction points (parking), price sensitivity, and the “jobs” customers hire you to do. This is how you analyze the local competitive landscape with precision.
Competitive structure comes next. Rank the three to five players that actually change buyer behavior for your core segments. Then run a focused SWOT on each: strengths you cannot or should not copy, weak spots you can target, and differentiators that matter in your neighborhood. For help separating real rivals from the decoys, see How to Identify Your Real Competitors (Not Who You Think They Are). To translate observations into strategy, use a template like How to Do a Competitor SWOT Analysis for Your Small Business. And when you need street-level signals on price and promo, try the playbook in How to Track Competitor Pricing and Marketing Without Expensive Tools.
Proprietary intelligence sharpens the picture. In March 2026, analyses produced via the Aurevon Intelligence Service for anonymized Canadian SMBs revealed three patterns owners can act on: Halifax seafood diners are punishing “tourist-trap” pricing while rewarding credible local sourcing and fair price cues; Calgary’s custom metal fabrication market is so saturated with near-perfect reviews that the real battleground is content visibility, localized supply chains, and visible tech adoption; and a Vancouver athletic wear retailer’s once-dominant share of local conversation is being clipped by big-box entrants on key streets and by influencer-fueled DTC brands, with persistent pushback on premium pricing. Translate those to your situation: show proof of value locally, compete on discoverability when quality is table stakes, and adjust price architecture when new channels reframe what “fair” looks like.
Finally, watch local economic signals that bend demand: migration to your city, commercial vacancies, wage growth, and interest rate expectations. The Bank of Canada’s Business Outlook Survey, for example, showed retailers reporting a modest improvement in demand after early-2025 softness, paired with caution on costs. That context matters when you plan inventory and cash. Bank of Canada
Data Sources and Tools
Reliable inputs beat hot takes. Here are sources Canadian owners can use today, plus how to turn them into decisions.
Government and agencies anchor your facts. Statistics Canada offers the Canadian Survey on Business Conditions, business counts by region, and neighborhood-level profiles you can query by Forward Sortation Area. Innovation, Science and Economic Development (ISED) compiles survival rates and employer-enterprise dynamics into one digest. Trade bodies publish sector-specific views that explain seasonality and margin pressure. Pair these with your own receipts, CRM lists, and review exports to build a ground-truth dataset. ISED Key Small Business Statistics 2025
Tools don’t need to be fancy to be effective. Search trends show what your neighbors type before they buy. Social listening highlights which competitors earn attention, not just stars. Simple scraping of Google Maps, Yelp, or Facebook reviews (export to CSV, tag themes, score by month) supports a practical Google reviews competitive analysis. For foot traffic, start analog: sample parking counts by hour for two weeks and log door swings. For pricing, snapshot your top five SKUs or services across the three rivals that actually move your customers. Repeat monthly. Want a structured method? Pair competitor identification with a lean price-and-promo tracker using this guide: track competitor pricing and marketing. If you prefer a single worksheet, set up a simple local market analysis template in a spreadsheet to keep sources, observations, and decisions aligned.
Here’s a quick comparison to decide where to start.
| Data Source | Type of Data | Reliability Rating | Accessibility |
|---|---|---|---|
| Statistics Canada (community profiles, business dynamics) | Demographics, business births/deaths, retail sales | High | Free, web portals |
| ISED Key Small Business Statistics | Survival rates, SME counts | High | Free PDF/website |
| Bank of Canada (BOS) | Demand outlook, capacity, pricing intentions | High | Free summaries |
| CMHC (Housing Market Information) | Housing starts, rents, vacancy | High | Free dashboards |
| Municipal open data portals | Permits, foot traffic proxies, transit counts | Medium | Free, variable quality |
| Trade associations (Restaurants Canada, Retail Council) | Sector trends, seasonal patterns | Medium–High | Member reports, press summaries |
| Review platforms (Google, Yelp, Facebook) | Sentiment, themes, frequency | Medium | Free to export with effort |
| Search and social tools (Google Trends, TikTok/Instagram search) | Interest spikes, influencer impact | Medium | Free/basic access |
| POS/CRM exports | Basket mix, repeat rates, zip/postal code reach | High | Your own systems |
Do this today: define a 10-minute trade area, pull its community profile from Statistics Canada, list your top five real rivals, and record their front-of-house prices for your three bestselling items. That 90-minute sprint gives you a baseline for “who buys, from where, and at what price.”
Interpreting the Data
Data is raw. Insight is cooked. Your job is to turn counts and comments into choices you can defend.
Start with segmentation that goes beyond age and income. Use behavior. For a neighborhood café, create three segments by visit frequency and time of day, then layer sensitivity to price by reading review language and deal redemption. For a fabrication shop, segment by job complexity and lead time, then score each segment on margin stability and reference value. Now weigh your segments using a simple TAM–SAM–SOM frame: total addressable buyers in your city, serviceable buyers in your trade area, and the share you can realistically win given current capacity. It keeps ambition honest.
Beware three traps. First, small-sample bias from a single busy weekend or a viral post that fades by Tuesday. Second, confusing correlation with causation (sales rose after you changed signage, but a pay cycle or festival may be the real driver). Third, ignoring context. When the Bank of Canada reports a slight demand improvement with caution on costs, it means discounting may bring volume but not profit unless you rebalance mix or supplier terms. Pair stats with street sense. Bank of Canada
A quick example shows how this works. Before: a Halifax seafood spot priced like a destination and bragged about awards, while reviews hammered “tourist pricing.” After: they anchored menus with a credibly sourced “local catch” at a fair entry price, labeled allergens clearly, and added one plant-based option. Sentiment flipped from “overpriced” to “good value for locals,” and weeknight covers stabilized. That aligns with March 2026 intelligence showing diners in Halifax rewarding credible local sourcing and fair pricing while punishing tourist-trap economics. See the pattern?
Now apply a similar read to saturation. In Calgary custom metal fabrication, where reviews are uniformly glowing, the differentiator isn’t stars. It is discoverability, supply chain reliability, and proof of tech adoption that shortens lead times. A shop that demonstrates local suppliers and posts short clips of CNC or robotic welding in action earns attention where five stars no longer do. That changes what you measure: content visibility and RFQ turnaround time, not just review averages.
Applying Insights to Business Strategy
Insight only pays when it touches operations. Translate what you learned into moves across offer, price, place, and message.
Offer: If review themes show allergy anxiety or diet flexibility as barriers, add one gluten-free batter, label allergens, and include a single high-quality plant-based option. If a retailer’s chatter flags sticker shock, reshape price ladders: keep a hero line at full freight, introduce good-better-best bundles, and add event-driven promos the neighborhood actually notices.
Price: Use competitive anchors from your three real rivals, then set entry prices that feel fair for locals and premium tiers that earn the step-up with visible quality cues. In saturated service categories, publish lead-time transparency and “on-time or 5% back” guarantees. That reframes value without a race to the bottom.
Place: If your footfall audit shows weekends heavy and weekdays light, shift staff and inventory accordingly. Consider micro-fulfilment for nearby condos or offices if your trade area skews dense and young. If new big-box entrants on your corridor are winning via selection, win the micro-moments: size exchanges in two hours, local pickup for repairs, staff who remember names.
Message: Show receipts of local value. Supplier spotlights, behind-the-scenes process clips, and short posts titled “Why our Tuesday price is what it is” reset perceptions. In markets where new players (JD Sports, Decathlon) and influencer-led brands (Vuori, Alo Yoga) steal attention, you cannot be silent. Presence is part of price.
Before/After, condensed:
- Before: One-size-fits-all offer, opaque pricing, and generic social posts. You hope word-of-mouth carries you.
- After: Three segment-specific offers, price architecture tied to local anchors, and content that answers the five objections you actually see in reviews. You manage demand, not just react to it.
🔑 Key Takeaway
Effective analysis of your local market can unlock new opportunities and drive business growth. It shows you where to compete, what to change, and what to ignore so you stop guessing and start steering.
For deeper competitive moves, revisit two tactics once your baseline is set: confirm who your true rivals are with this guide to identifying competitors and turn observations into a plan with a concise competitor SWOT.
Common Questions About Your Local Market
What does a local market study include?
It is a structured examination of a defined trade area that covers who your buyers are, which competitors shape their choices, and which economic conditions support or suppress demand. Done well, it informs decisions on site selection, assortment, pricing, and promotion instead of leaving them to gut feel.
Why is this work important for small businesses?
Owners win or lose within a few kilometers of their door. A grounded read of local demographics, the competitive set that actually moves your customers, and neighborhood economics helps you spot where to double down and where to pull back. In a climate where red tape eats days and capital is cautious, clarity is an edge. CFIB ISED 2025
How can I collect data for my market study, and where can I find demographics for my area?
Combine public sources and your own signals. Pull Statistics Canada community profiles for your postal codes, scan the Bank of Canada’s Business Outlook Survey for demand direction, export recent reviews to tag themes, and walk your block to log footfall by hour for two weeks. To analyze your local competition, shortlist three to five true substitutes, record their entry prices and lead times, and check their visibility on Google Maps. For a quick read of competitor sentiment, open each rival’s profile on Google Maps, filter the Reviews tab by most recent and by lowest star ratings, tag recurring themes like wait time, price fairness, and staff knowledge, then compare month by month. Ground-truth your top three assumptions with five short customer interviews or intercepts in front of your store. Statistics Canada Bank of Canada
What tools can help me spot local market trends?
Start simple. Google Trends for interest spikes, built-in analytics from Instagram and TikTok for post-level engagement, review exports for sentiment, and spreadsheet-friendly price trackers are enough to reveal movement. Layer sector reports from credible bodies like the Retail Council or BDC when you need seasonal or national context. These are inputs, not answers, your street-level checks keep them honest. Retail Council of Canada BDC
Ready for a next step you can take today? Block 90 minutes, define your 10-minute trade area, pull its StatsCan profile, and build a one-page sheet with your three real rivals, their entry prices on your top three items, and the five themes that appear most often in your last 50 reviews. You will know exactly what to fix first.
To turn the kind of neighborhood-level signals discussed here into a single, decision-ready brief, Aurevon’s Ecosystem Dynamics Report brings together competitive posture, local demand shifts, and economic context for Canadian SMBs. See how it fits your next decision at aurevon.ca.
Mitchell Ozmun
SMB Researcher, Business Analyst - Saskatchewan Born and Raised