How 2026's Industry Trends Can Shield Your Small Business
The warning signs arrive quietly. A regular customer stops coming. A supplier shortens terms. A new name dominates search results in your city. Miss the pattern long enough and the market moves without you. That is why treating industry signals as background noise is costly. Paying attention turns risk into cover.
Which signals matter most right now? The ones reshaping how customers buy, how work gets done, and how your local market shifts underfoot: steady digital adoption, rising expectations for speed and value, consolidation in key niches, practical AI, sustainability rules creeping into RFPs, and new workforce math. The play is simple and hard at once: monitor deliberately, interpret with context, and act on a cadence. That is the core of industry trends small business owners can actually use.
Related: Best Instagram Marketing Strategy For Small Business 2026 (PROVEN & PROFITABLE) — Alex Cattoni
Understanding Industry Trends
“Industry trends” aren’t headlines. They are repeatable patterns in customer behavior, input costs, competitor tactics, and policy that change the odds for your next decision. Think of them as the currents under the waves. You can’t steer the ocean, but you can set the right heading.
Three levers explain why they matter. First, demand. Canadian consumers still prefer stores for many categories, even after the e‑commerce surge; six in ten mostly shop in person, according to a 2025 KPMG report, which reframes how omnichannel really works in practice for SMBs (KPMG). Second, cost and capital. The Bank of Canada’s January 28, 2026 Monetary Policy Report projects growth around 1.25% with inflation near 2%, while noting unusually high uncertainty tied to trade risks. That affects borrowing plans and price architecture for the next 12 months (Bank of Canada MPR). Third, channel mix. Statistics Canada shows retail e‑commerce revenue reached $67.7B in 2023, up 7%, confirming steady digital demand even as in‑store rebounds (Statistics Canada). See the tension? Stores still matter. So does online. The mix shifted and keeps shifting.
What does this mean for you? Trends change operational math. If customer expectations tilt toward faster turnarounds, your bottleneck might be approvals, not machines. If regional consolidation squeezes visibility, content and local partnerships decide who gets the first call. If policy nudges greener supply chains, your vendor list becomes a sales asset, not a back‑office detail. And if you are sequencing digital transformation small business projects, focus them where the friction is most visible to customers.
Proactive owners build a habit: scan signals, frame a hypothesis, test small, then scale. It’s like setting two chess clocks—one for learning, one for action—and making sure neither runs out.
Before we go tactical, one more stake in the ground. Confidence wobbles change timing. The CFIB’s March 2026 Business Barometer long‑term index fell to 55.8, almost 10 points down from February, a sign that many owners expect softer conditions ahead. That is not a reason to pause trend work; it is the reason to do it with focus (CFIB Barometer).
Identifying Relevant Trends for Small Businesses
With countless headlines flying by, how do you separate signal from noise? Start close to the ground and work outward.
Begin with customers. Pull three months of order data and tag each line with “who/what/why” in plain language. A Halifax accounting firm might find a sudden uptick in start‑up engagements tied to immigration‑driven new businesses. A Regina HVAC shop could see more inquiries for heat pumps after a utility rebate tweak. Patterns whisper before they shout.
Then test the wider market. For quick directional reads, learn how to monitor industry trends with free tools: set Google Alerts for two competitors and one regulation keyword, track search interest on Google Trends for your top product plus city, scan Google Maps for local pack shifts and new reviews, and bookmark a Statistics Canada data table that actually maps to your revenue drivers. Pair these with qualitative inputs: a quarterly call with two suppliers and a standing 15‑minute huddle with sales on “what changed this week.” It takes an hour per week. It pays for itself.
External research adds backbone. Industry association newsletters, local chambers, BDC briefs, and sector bulletins often flag regulatory shifts months before they land. For competitive structure, read “who’s hiring for what” on LinkedIn to spot capability moves. When you need deeper structure on rivals, use a field guide like How to Identify Your Real Competitors (Not Who You Think They Are) and pair it with a lightweight Competitor SWOT to crystallize where trends hit you hardest. To turn industry reports into strategy, pull the two numbers that map to your funnel, write one hypothesis per number, and run a single pilot.
Here’s a compact way to compare your main sources of trend signals:
| Signal Source | What It Tells You | Refresh Rate | How to Get It | Risk If Ignored |
|---|---|---|---|---|
| Customer transactions | Demand shifts by product and segment | Daily to monthly | POS/ERP exports | Stockouts or dead inventory |
| Supplier updates | Lead times, input costs | Weekly to monthly | Emails, calls | Margin squeeze without warning |
| Competitor digital footprint | Positioning, promos, hiring | Weekly | Track competitor pricing and marketing | Surprise launches |
| Government and regulator bulletins | Compliance and program changes | Monthly to quarterly | Newsletters, RSS | Fines, missed incentives |
| Social and review chatter | Perception, service gaps | Daily | Social listening, review scans | Reputation drift |
Do this today: schedule a 30‑minute block this Friday to set up three alerts (one product keyword, one competitor, one policy term) and a saved StatCan table. Then assign each to a teammate with a standing monthly “trend check” reminder.
As you sift, watch for compound effects. For example, Deloitte’s 2025 retail outlook projected a 3% rise in holiday spending and highlighted AI‑shaped shopping journeys, which can amplify local winners who blend smart merchandising with rapid fulfillment (Deloitte Canada). Pair macro hints like this with your micro data to avoid chasing fads.
If you want a deeper playbook, see How to Monitor Industry Trends and this take on How AI Is Changing Small Business in Canada.
Adapting Business Strategies to Trends
Spotting the pattern is only half the job. The win comes from translating it into design choices you can measure.
One approach is to run “trend sprints”: six‑week experiments scoped to one lever. If sustainability rules are creeping into bids, test a local‑supplier SKU switch for a single product line and add transparent sourcing notes on the product page. If workforce availability tightens, pilot a four‑day schedule for one crew to widen your hiring pool and track output per hour, not hours worked. If your category tips toward same‑day expectations, redraw your service radius and offer paid rush in one zone before rolling it out.
Here’s how this actually works. Before: your quoting process sits in an inbox for two days while one manager triages. After: you template the ten most common jobs, cap the info you request to five fields, and publish a 24‑hour quote promise. The change ties to a clear trend (faster expectations) and a measurable outcome (quote turnaround, close rate, average order value). See the difference?
Bring context from the field. Across Canadian manufacturing SMBs analyzed via the Aurevon Intelligence Service in March 2026, Calgary’s custom metal fabrication market is saturated with near‑perfect reviews, shifting the battleground to content visibility, localized supply chains, and visible technology adoption. Translation: “be great” is table stakes; the winners show how work flows through their shop, document lead‑time reliability, and signal modern equipment. That’s a strategy shift you can implement in weeks, not years.
Two guardrails keep adaptation disciplined. First, tie every test to one KPI. If the trend is “price sensitivity rising,” decide whether you are protecting margin or defending volume before you act. Second, set a stop condition. If the pilot misses by a defined threshold after two cycles, kill it and move on. Momentum, not sunk‑cost drama.
🔑 Key Takeaway
Regularly reviewing industry trends can prevent stagnation and promote innovation in your business.
For more structure on judging rivals while you adapt, keep this primer handy: How to Do a Competitor SWOT Analysis for Your Small Business.
Tools for Trend Analysis
You don’t need a wall of dashboards to stay current. You need a small stack that covers demand signals, competitor moves, and policy changes, with data you can interpret in under an hour a week.
Start with search and site analytics. Google Trends helps you see relative interest over time for your core terms by province or city. Your own analytics show where traffic comes from, which landing pages convert, and how mobile behavior differs from desktop. Pair that with a StatCan Data Browser table that maps to your revenue driver, like retail sales for your NAICS code in your province.
Add social and news monitoring. A basic setup might include a saved X (Twitter) search for your city plus category, a review site scan once a week, and a news alert for your industry regulator. If social fuels your category, pick one tool with decent sentiment signals and workflow. If you have a storefront, use Google Maps to monitor reviews, photo updates, and competitor visibility in the local pack.
Round it out with competitor intelligence. Look for tools that show paid and organic search moves, ad copy changes, and hiring signals. The goal isn’t to copy; it’s to detect direction.
Comparison of popular monitoring options:
| Tool Name | Features | Pricing | Best For |
|---|---|---|---|
| Google Trends | Keyword interest by region, seasonality | Free | Directional demand checks |
| StatCan Data Browser | Official economic and sector data | Free | Policy‑grade baselines |
| Search Console + Analytics | Queries, pages, conversions | Free | Your demand funnel |
| Semrush or Similarweb | Traffic sources, keywords, ads | Paid tiers | Competitor digital moves |
| Sprout Social or Hootsuite | Social monitoring, scheduling | Paid tiers | Brands with active social |
| Meltwater or Cision | Media mentions, sentiment | Enterprise | PR‑heavy categories |
| CB Insights or PitchBook | Market maps, funding signals | Enterprise | Tech‑adjacent sectors |
Evaluate tools by two filters: “Will this change a decision?” and “Can a manager act on this in 24 hours?” If the answer to either is no, keep shopping.
For a lighter on‑ramp to competitive tracking without big subscriptions, try these field guides: How to Track Competitor Pricing and Marketing Without Expensive Tools and a condensed cluster on Small Business Trends in Canada.
Case Studies of Successful Adaptation
Consider three snapshots that show adaptation in motion.
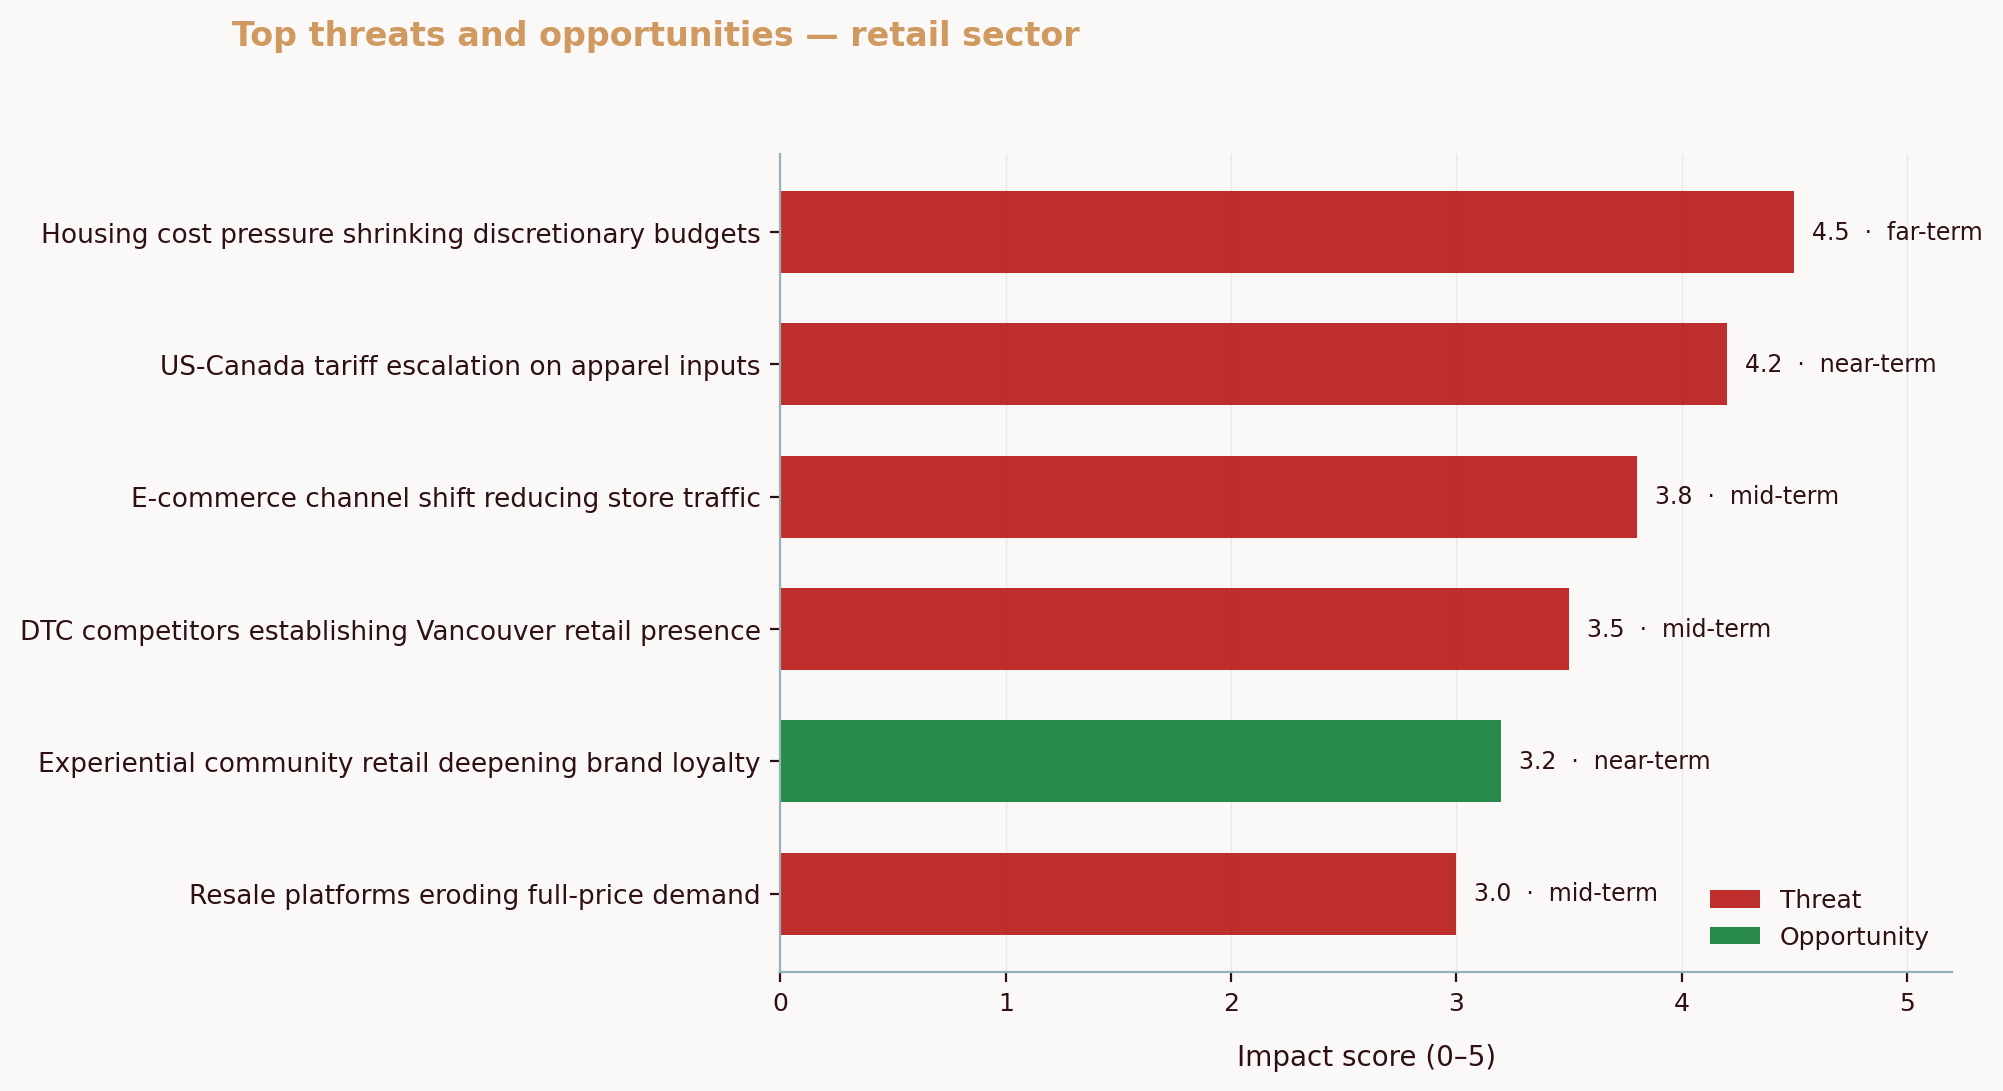
First, a Vancouver retail business dominated local athletic‑wear chatter, peaking at about 40% of social mentions. In a separate anonymized analysis from March 2026, that lead began eroding from two sides at once: global entrants opening prime‑street locations and influencer‑led brands undercutting on style cycles and price pressure. The response that worked? Tighten the hero assortment, commit to value‑anchored bundles during event windows, and publish transparent pricing logic on a rotating set of staples. The lesson: when the conversation fragments, clarity beats breadth.
Second, a Saskatoon sports bar faced a triple squeeze: guests demanded better value, stronger signals of food safety, and more compelling atmospheres, all while margins thinned. By sequencing upgrades, menu engineering for cost‑per‑guest first, then visible prep‑area standards, then a targeted game‑night experience, the unit recovered traffic without racing to the bottom on price. The takeaway is simple. Meet the trust need before the show, then earn dwell time.
Third, a hypothetical example from professional services. Imagine a Calgary bookkeeping firm noticing two shifts in its intake: more side‑hustle incorporations and more AI‑curious founders asking about workflow automation. The firm pilots a fixed‑scope “first‑year compliance + automation starter” package for micro‑businesses. Before: ad hoc hourly work, unpredictable hours. After: a clear bundle, tutorial videos, and a quarterly check‑in cadence that reduces WIP thrash. Revenue per client stabilizes, and referrals rise because the bundle names the job to be done.
See how that works? Trends tell you where customer friction moved. Your adaptation names and solves it with a measurable change.
To keep your play steady, anchor decisions with two external lenses. One, macro context: the Bank of Canada’s January 2026 outlook warns of elevated trade‑policy uncertainty, which can ripple through supplier pricing and delivery windows (Bank of Canada MPR). Two, local sentiment: the CFIB Barometer’s March 2026 dip suggests caution among peers, a reminder to stress‑test cash flow before full rollout of any change (CFIB Barometer). Pair those with ground truth from your CRM and POS, and you won’t get blindsided.
Common Questions About Industry Trends for Small Businesses
What are the most important industry trends for small businesses to watch?
It depends on your category, but three buckets recur: technology shifts that change how work gets done, customer behavior that changes what “value” means, and regulation that changes cost or compliance burden. If you sell to consumers, balance your read of in‑store and digital behavior with channel expectations in your city. Recent Canadian data shows both lanes still matter, which affects staffing, inventory, and fulfillment choices (KPMG; Statistics Canada).
How do you keep up with industry trends?
Keep it simple. Use Google Trends for directional demand, your own analytics for conversion health, and one social or news monitor for category chatter. Subscribe to at least one trusted macro source so surprises are rare; the Bank of Canada’s quarterly MPR is a good baseline for rates, growth, and risks (Bank of Canada MPR). Add a quarterly supplier call and a monthly sales huddle, and your “system” is set.
How can small businesses benefit from AI?
Treat AI as a force multiplier, not a magic trick. Start with workflow hotspots: automate repeat admin like invoice routing and reconciliations, use AI‑assisted drafting to speed proposals and job posts, and test AI‑powered demand forecasts or inventory alerts where you have stable data. In marketing, small teams can produce more with AI‑aided briefs and image variants while keeping a human editor in the loop. This is how AI is changing small business outcomes without overhauling your stack, faster quotes, fewer errors, and better allocation of scarce hours.
What are the trends in Canadian small business?
Two patterns stand out in 2025 and early 2026. One, the channel mix continues to balance in‑store strength with steady online growth, as shown by Statistics Canada’s e‑commerce revenue climb and KPMG’s in‑store preference data (Statistics Canada; KPMG). Two, sentiment is cautious, with CFIB’s March 2026 barometer dipping, which often slows hiring and big‑ticket investments among smaller firms (CFIB Barometer). BDC surveys echo a practical focus on productivity improvements and automation, especially where labour is tight. For local context, watch Google Maps visibility and reviews in your city to see who is winning nearby.
How do you use an industry report?
Skim for the three pages that map to your revenue drivers, mark the data series you can track, then turn industry reports into strategy by writing a one‑line hypothesis per datapoint. Assign one KPI, pick a six‑week pilot, set a stop condition, and schedule a post‑mortem. If a number moves, standardize the playbook. If not, log the learning and move on.
What should I do if I identify a trend that could impact my business?
Size the relevance first. Ask: which segment, which product, which metric? Draft one hypothesis, pick one KPI, and run a time‑boxed pilot in a single location or line. If it moves the number, expand with a clear checklist. If not, stop and document the learning so you don’t repeat the test later.
Is it necessary to adapt to every industry trend?
No. Chasing everything spreads your team thin. Prioritize trends that intersect with your strategy and your customers’ pain points. A clear competitor map helps here; start with How to Identify Your Real Competitors and a short SWOT to decide where a trend amplifies your edge versus drags you into a race you can’t win.
A focused way to apply what you’ve read: block 60 minutes this week to 1) set up three alerts, 2) pick one KPI that matters this quarter, and 3) choose a six‑week pilot tied to a single trend. Start the clock.
Aurevon’s Ecosystem Dynamics Report distills live market signals, competitive shifts, and policy changes into an SMB‑ready action plan. If you’re ready to turn noise into next steps, learn more at aurevon.ca/ecosystem-dynamics-report.
Mitchell Ozmun
SMB Researcher, Business Analyst - Saskatchewan Born and Raised