Why Canadian SMBs Are Turning to Market Intelligence in 2026
Your ads stall. A rival undercuts your price. Reviews climb, but calls don’t. The campaign ends and the cash goes with it. That’s what happens when decisions ride on hunches instead of hard signals. For Canadian owners, data isn’t a “nice to have.” It is the steering wheel. And it’s how data-driven growth small business efforts turn scattered tactics into a repeatable system for finding demand, defending margins, and expanding with confidence.
Think of market intelligence as a live map of where customers are moving, what competitors are signaling, and which channels still have headroom. You trade guesswork for evidence. You pick markets, prices, and promotions based on what people actually do, not what you hope they do. That changes the growth math.
Related: How to Build a Data-Driven Business — 365 Data Science
Understanding Data-Driven Growth
Data-driven growth means tying your decisions to measured behaviour: what buyers search, where they click, why they abandon, which features they use, and how competitors reposition. The difference from intuition-led management isn’t subtle. Intuition can spot patterns, but it tends to overweight the last loud customer, the best-performing salesperson’s view, or a founder’s bias. A data-led approach sets hypotheses, tracks the few metrics that confirm or kill them, and ships changes in smaller, faster cycles.
Here’s the practical shape this takes. You define the questions first, not the dashboards. Which segment has the shortest payback? Which product variant is cannibalizing core sales? Which channel still scales at acceptable acquisition cost? Then you collect only what answers those questions: daily store traffic, top search terms in your city, competitor price moves, checkout friction points, and post-purchase support tickets. Everything else is noise.
Market intelligence sits at the centre of this. It’s the discipline of monitoring customers, rivals, regulators, and partners so that moves are timed and targeted. Picture a hockey coach watching line changes in real time. If the opposing winger tires, you rush your fastest line. Intelligence makes business timing just as deliberate: you spot a new entrant pushing discount bundles, a wholesaler shortening payment terms, or a municipal permit backlog that could stall your expansion. You move first, or you step aside early.
A quick example. Imagine a Halifax accounting firm torn between promoting bookkeeping packages or advisory retainers. Web analytics show local searches surging for “cash flow forecast template,” while CRM notes flag repeated questions about payroll rebates. Instead of splitting budget evenly, the firm builds a “90-day cash clarity” advisory bundle, pairs it with content around payroll credits, and watches lead quality climb. Before: equal spend across services because “both matter.” After: resource allocation follows demand signals, not opinions. See the difference?
One more principle matters: granularity. Canada isn’t one market. A keyword that converts in Calgary can flop in Ottawa. Social chatter that shapes Vancouver’s athleisure demand might not register in Saskatoon. Smart SMBs track at city level where possible and adapt promotions, stock, and staffing to local signal. As context, small businesses make up the vast majority of employer firms in Canada, which means most competition you face is local and fast-moving, not distant and slow-moving. Statistics Canada and ISED both track the composition and dynamics of the small firm landscape, and you can find scope and definitions at ISED’s Key Small Business Statistics. For local intent and proximity checks, owners often scan Google Maps results and reviews to see who actually shows up for nearby customers.
So the risk is real. What can you do about it? Start by seeing where intelligence removes uncertainty the quickest.
Importance of Market Intelligence for SMBs
Without market intelligence, three traps eat growth. First, misreading demand: campaigns point at the wrong segment, promos run during the wrong week, inventory lands after the spike. Second, blind spots about competitors: pricing pivots or new bundles appear and you find out in your sales slump. Third, operational drift: teams ship features or buy inventory that can’t win the shelf, on- or offline.
With a disciplined view of the market, you cut the error rate in planning. You compare what buyers search to what they buy, then adjust copy, bundles, and discounts accordingly. You monitor competitor rank and reviews, not to copy them, but to find open edges: an underserved neighbourhood, a delivery promise you can actually keep, or a warranty they avoid. You also catch macro pressure early. For instance, small business confidence trends fluctuate with costs and demand cycles; scanning the CFIB Business Barometer monthly gives you a sense of how your peers are feeling and where caution—or courage—might be warranted.
How does competitive intelligence help a business grow? It reveals where you can win before you spend, shows which messages pull qualified demand, and flags price and product shifts early enough to respond. Used well, competitive intelligence grow revenue by surfacing underserved segments, guiding sharper offers, and preventing wasted spend.
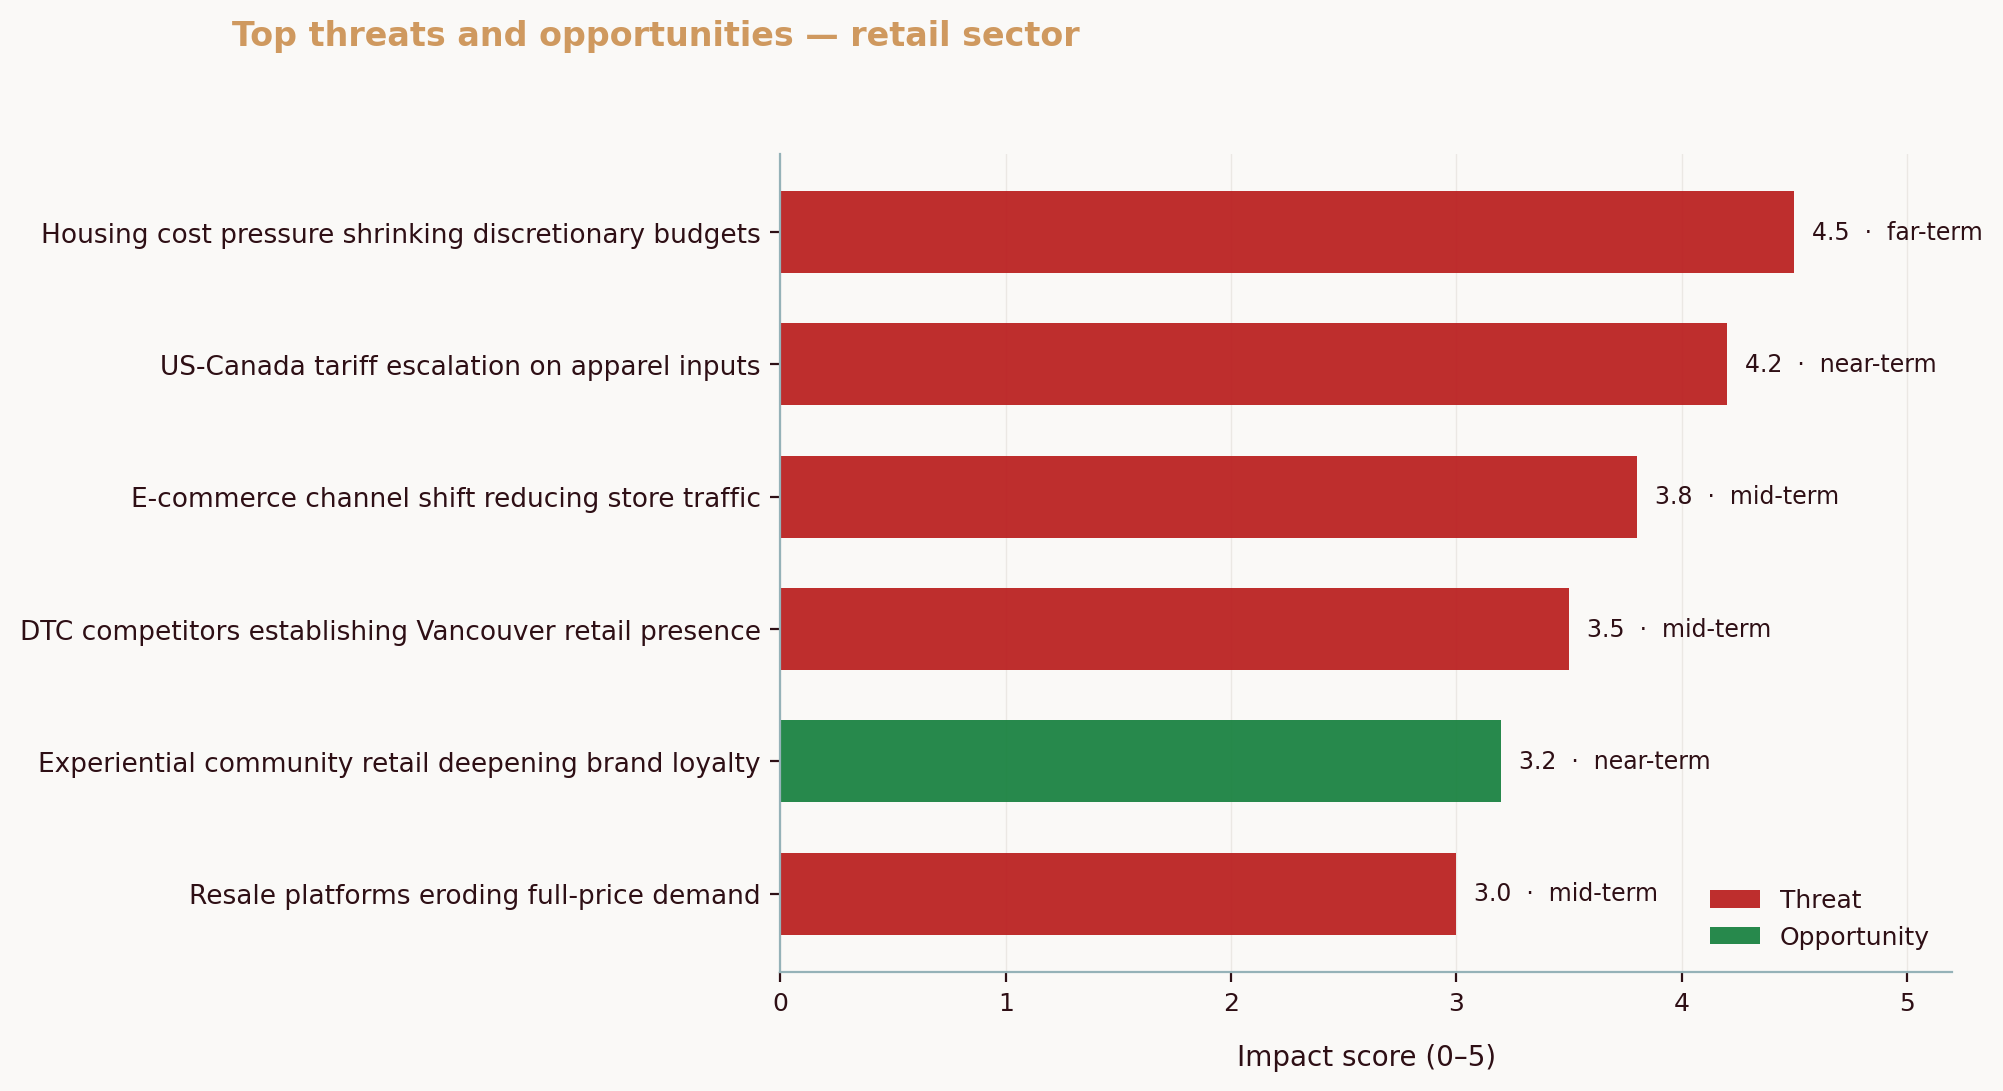
Proprietary intelligence sharpens this further. In analyses conducted via the Aurevon Intelligence Service—including a Calgary custom metal fabricator (2026-03) and a Vancouver athletic-wear retailer (March 2026)—we found two patterns that matter for owners. In Calgary, near-perfect online ratings mean “quality” no longer differentiates; visibility, local supply resilience, and proof of tech adoption do. In Vancouver, a single retailer’s share of social conversation is being chipped away from multiple angles at once: new international chains opening nearby and influencer-driven upstarts squeezing premium price points. The lesson is simple: once quality converges, the battle moves to discoverability, narrative, and speed of offer adjustment.
What does that mean in practice? Three moves:
- Tighten local listening. Track city-level searches and social mentions weekly. If “same-day pickup” queries rise in your postal codes, test a micro-pilot at one store instead of rolling out chain-wide. Google Maps search patterns and review velocity can validate whether local intent is shifting in your favour.
- Treat pricing as a signal, not a secret. If rivals bunch around a price anchor, you can either reframe value (bundles, guarantees, financing) or move the anchor with a bold high-low strategy. The wrong move is to retreat to “cost plus” in the dark. To determine pricing based on competitors, build a simple pricing strategy competitive data worksheet: list the top 10 SKUs or packages, capture competitors’ list and promo prices, note shipping or service promises, calculate your contribution margin at three test points, then A/B test two price endpoints for two weeks and monitor conversion, returns, and margin.
- Build a competitive intelligence routine that is boring and repeatable. For a field-tested starter, see How to Track Competitor Pricing and Marketing Without Expensive Tools.
Owners also worry about ROI. Fair. Data projects can sprawl. The counter is to connect intelligence to one measurable lever at a time: higher lead-to-close in a niche, faster stock turns on top SKUs, fewer refunds after a packaging change. As a grounding reference on building data capability step by step, BDC’s practical guide on decision-making with analytics is a helpful read: Make better business decisions with data analytics.
How do you know when to expand your business? Use market intelligence business expansion signals, not gut alone. Look for a 3–6 month trend of capacity constraints or waitlists, stable unit economics across two or more neighbourhoods, rising conversion from adjacent postal codes, and the ability to staff and supply reliably. Cross-check municipal permit timelines and financing conditions before you lock dates.
Bridge to tools: if intelligence is the “what” and “why,” your stack is the “how.”
Tools and Technologies for Data Analysis
For SMBs, the right stack is small, connected, and boring. You need tools that capture demand, compare your position, and report results without weeks of setup. Most owners can start with four layers: website/app analytics, search and social listening, competitor tracking, and BI reporting.
Selection criteria are simple. First, clarity: can a manager answer real questions in minutes? Second, fit: does it connect to the systems you already run, like your POS or ad platforms? Third, control: can you export your data when you grow out of the tool? Fourth, cost: are there free or starter tiers that let you prove ROI before upgrading?
Examples many Canadian SMBs use daily include Google Analytics 4 for digital behaviour, Looker Studio or Microsoft Power BI for dashboards, and platforms like Similarweb, Semrush, or Ahrefs for share-of-voice and keyword gaps. Social listening tools (native dashboards, Sprout Social, or Brandwatch) catch conversation shifts. For local discovery and proximity analysis, owners often sanity-check coverage and reviews in Google Maps before they commit spend. Price-tracking can be as simple as structured weekly checks in a spreadsheet to start; automate later.
Here’s a quick comparison to orient your choices.
| Tool Name | Main Features | Pricing | Ease of Use |
|---|---|---|---|
| Google Analytics 4 | Web/app behaviour, funnel analysis, attribution models | Free | Moderate (setup required) |
| Looker Studio | Connects data sources, builds shareable dashboards | Free + paid connectors | Easy |
| Microsoft Power BI | Data modeling, interactive reports, native Excel/Teams links | Free desktop + paid cloud tiers | Moderate |
| Tableau | Visual analytics, strong storytelling visuals | Paid tiers | Moderate |
| Semrush | Keyword gaps, rank tracking, competitor ad snapshots | Paid tiers | Moderate |
| Similarweb | Traffic sources, category benchmarks, referral analysis | Paid tiers | Easy |
| Ahrefs | Backlink audits, content gaps, rank tracking | Paid tiers | Moderate |
| Sprout Social | Multi-network social listening and scheduling | Paid tiers | Easy |
Two pitfalls to avoid: collecting data you’ll never use and letting tools dictate your questions. Start with the business decision, then pick the metric.
💡 Pro Tip
Choose tools that integrate well with your existing systems for a smoother transition. A simple rule: if connecting your POS, ad platforms, and CRM requires custom code, you’re overbuying for now.
“Do this today” action: schedule a 30‑minute weekly review with a standing agenda—top five search terms rising in your city, competitors’ price changes on your two highest-margin items, and one customer friction metric (cart abandonment, phone wait time). Lock it to the same time each week. Small cadence, big signal. How often should you analyze competitors? In fast-moving categories, scan price and promo changes daily, review rankings and reviews weekly, and run a deeper positioning and feature check monthly. Do a quarterly reset that compares your moves to theirs so you do not drift.
For tactical support on scoping who you’re really up against, bookmark How to Identify Your Real Competitors (Not Who You Think They Are) and use the field worksheet inside. When you’re ready to stress-test rivals, pull this template: How to Do a Competitor SWOT Analysis for Your Small Business.
Case Studies and Success Stories
Consider three short Canadian scenarios that mirror common growth walls.
A specialty grocer in Toronto struggles with thin margins and constant promo wars. Intelligence shows that busy professionals within a 2‑kilometre radius over-index on “meal kits near me.” The store repackages best-selling SKUs into five ready-to-cook bundles, pairs them with search ads against that term, and runs a two-week A/B test on pickup hours. Before: broad discounts and margin pain. After: fewer, focused bundles with higher basket size and consistent pickup windows tied to search behaviour. The grocer doesn’t chase every shopper; it meets one segment where intent already lives.
A B2B HVAC firm in Edmonton keeps losing mid-market RFPs. Competitor tracking reveals that two rivals win deals by bundling remote monitoring and next-day service windows. Content analysis shows their case studies dominate local search. The firm pilots three “smart maintenance” packages, publishes proof of service outcomes, and retargets site visitors who read those pages. Think of it like sending two salespeople to pitch the same client: one shows up with anecdotes, the other arrives with logged performance and a calendar link. Who gets the call?
A DTC apparel brand in Winnipeg sees rising returns and rising ad costs. Social listening finds complaints about fit and calls for extended sizes. The brand cuts spend on broad awareness, shifts to “find your fit” creatives, and runs a sizing quiz to collect zero-party data (information the customer gives you directly). It then launches a small-batch extended line and emails only those who asked. Returns drop. CAC softens. That’s data turning to dollars.
These snapshots echo wider patterns owners can monitor through public data as context. For example, national conditions and demand expectations cycle through the year; tracking confidence readings alongside your pipeline helps you calibrate targets and cash buffers. The CFIB index above provides a quick monthly pulse, and you can combine that with your own pipeline metrics to avoid overreacting to a single slow week. For macro and policy signals that affect rates and financing costs, the Bank of Canada’s data and analysis hub is worth bookmarking. These are practical ways a small business beat bigger competitors when larger brands are slow to adjust.
Want to build your own case study? Start with one growth lever and one intelligence source. If your lever is revenue per visit, pair it with a competitor pricing scan and a content gap analysis. If your lever is store traffic, map rising local search terms to in-store promotions. Then write down the before/after baseline so you can tell if the move worked. Small experiments stack into strategy.
Common Questions About Data-Driven Growth
What is data-driven growth?
Data-driven growth refers to the strategy of making business decisions based on data analysis rather than intuition or guesswork. This approach helps businesses understand market trends, customer preferences, and operational efficiencies. In practice, it means writing questions first, collecting only the data that answers them, and changing course quickly when the numbers say you should.
How can small businesses afford market intelligence tools?
Many market intelligence tools offer tiered pricing or free versions that are suitable for SMBs. By starting small and gradually investing in more advanced features, businesses can use data without overwhelming their budgets. A smart path is to begin with free analytics and a lightweight dashboard, then add one paid tool that directly supports a single KPI, like reducing acquisition cost or improving stock turns.
What are some common mistakes SMBs make with data?
Common mistakes include failing to define clear objectives, relying on outdated or incomplete data, and neglecting to train staff on interpretation. Another frequent error is averaging signals across regions and missing local differences that actually drive outcomes. A quick safeguard is to document a monthly “kill or keep” review for any metric that isn’t influencing a decision.
How do I measure the success of my data-driven initiatives?
Tie measurement to business goals: increased sales, improved customer satisfaction, lower returns, shorter sales cycles, or more efficient operations. Choose 3–5 KPIs, set a time-bound target, and create a weekly ritual to check progress. For background on structuring those reviews, see BDC’s guide on decision-making with analytics and the government’s snapshot of small firm dynamics at ISED’s Key Small Business Statistics.
Ready to turn market noise into next steps? If you want a condensed view of your category’s players, channels, and momentum, Aurevon’s Ecosystem Dynamics Report distills competitive moves and demand signals into actions a small team can execute. Get the details and a sample outline here: Ecosystem Dynamics Report.
Mitchell Ozmun
SMB Researcher, Business Analyst - Saskatchewan Born and Raised