Unlocking Business Intelligence for Small Businesses in 2026
Orders dip. Phones stay quiet. Ads eat cash. You guess at fixes. The week crawls. The risk is simple: without a clear read on what is working, you spend scarce time and money in the dark. Business intelligence for small business is the switch that turns on the light. It means collecting and analyzing the data you already touch (sales, customers, competitors, market signals) to make decisions with evidence, not hunches.
Related: How I’d Build a 1-Person AI Business (0 to $1M+) — theMITmonk
Definition of Business Intelligence
What is business intelligence? Think of it as the practice of turning raw business data into decisions. In simple terms, it is a system that pulls data together, cleans it, and shows it in a way that helps you choose your next move. It blends three layers: collecting data from the systems you already use (point of sale, accounting, CRM, website analytics), organizing it for consistency and access, and presenting it in business intelligence reports or dashboards that answer practical questions. The goal is clear and simple: faster, better choices.
It helps to separate BI from other data practices. Data management focuses on storage and governance, like making sure product SKUs match across systems. Reporting is the regular snapshot, such as weekly sales by store. Analytics asks why sales rose in one store and fell in another, and what will likely happen next. If data management is your pantry, BI is the recipe, and analytics is the taste test that tells you whether to add more salt.
A quick note on competitive intelligence vs business intelligence. Competitive intelligence tracks rival moves and market shifts so you can respond. Business intelligence focuses on your internal and nearby external data, then turns it into repeatable decisions. You often need both.
Three concepts anchor most small-business BI:
- Descriptive analytics: what happened (last month’s conversion rate).
- Diagnostic analytics: why it happened (traffic source mix shifted toward lower-intent channels).
- Predictive and prescriptive analytics: what could happen, and what to do (inventory reorder points based on seasonality).
Where does the data come from? Start local, then expand. “Local” means your invoices, card terminal exports, Shopify or WooCommerce orders, Google Analytics traffic, email platform engagement, and a simple spreadsheet of competitor prices or offers you collect weekly. “Expand” means public sources like Statistics Canada’s business tables, municipal open-data portals, and social listening to gauge local brand chatter. A practical anchor: a neighborhood retailer can marry POS data with footfall estimates from Google Maps Popular Times and Instagram engagement to align staff schedules and promotions with actual peaks.
The format matters less than the question. If your question is “Which three SKUs drive most returns?” then a tidy Excel pivot beats a complex database you never use. As questions mature, tools help you automate refresh, join sources, and standardize definitions. Think of BI as the cockpit instruments for your company. You can still fly by sight on a clear day. When weather shifts, instruments keep you straight.
If this already feels heavy, keep the focus tight: one decision, one metric, one view. Small, repeated wins beat a sprawling dashboard you ignore.
With the foundation set, the real reason BI matters becomes obvious: better choices beat guesswork when margins are thin and competitors move fast.
Importance of Data-Driven Decision Making
Data-driven decisions turn uncertainty into options. A well-known study from MIT found firms that emphasize data-driven decision making show 5% to 6% higher productivity than expected given their other investments. In a low-margin environment, that edge funds hiring, marketing, or much needed breathing room. (https://papers.ssrn.com/sol3/Delivery.cfm/SSRNID1968725code1376648.pdf?abstractid=1819486&mirid=1&type=2)
Canadian data points to the same path. In the Canadian Survey on Business Conditions, businesses singled out technology adoption and innovation as the top factor improving operating efficiency over the prior year, a signal that applied analytics pays off in day-to-day performance. For small firms, that can look like smarter staffing, tighter reorder points, or cutting two underperforming ads to fund the one that converts. (https://www150.statcan.gc.ca/n1/pub/11-621-m/11-621-m2024008-eng.pdf)
Adoption is uneven, which is an opportunity. Statistics Canada’s 2023 SDTIU showed AI use remained far lower among small businesses than large ones, while cloud tools were widespread. Translation: the plumbing is there, but many SMBs haven’t connected it to consistent analysis yet. That gap is where gains hide. (https://www150.statcan.gc.ca/n1/daily-quotidien/240917/dq240917c-eng.htm)
Larger companies are still ahead on advanced analytics, with the Canadian Chamber’s Business Data Lab reporting that big firms were nearly twice as likely to adopt generative AI as small ones in early 2024. For smaller players, that means you can cherry-pick focused use cases, such as automating weekly pricing scrapes or forecasting demand for your top ten SKUs, without building a research lab. (https://businessdatalab.ca/publications/prompting-productivity-generative-ai-adoption-by-canadian-businesses/)
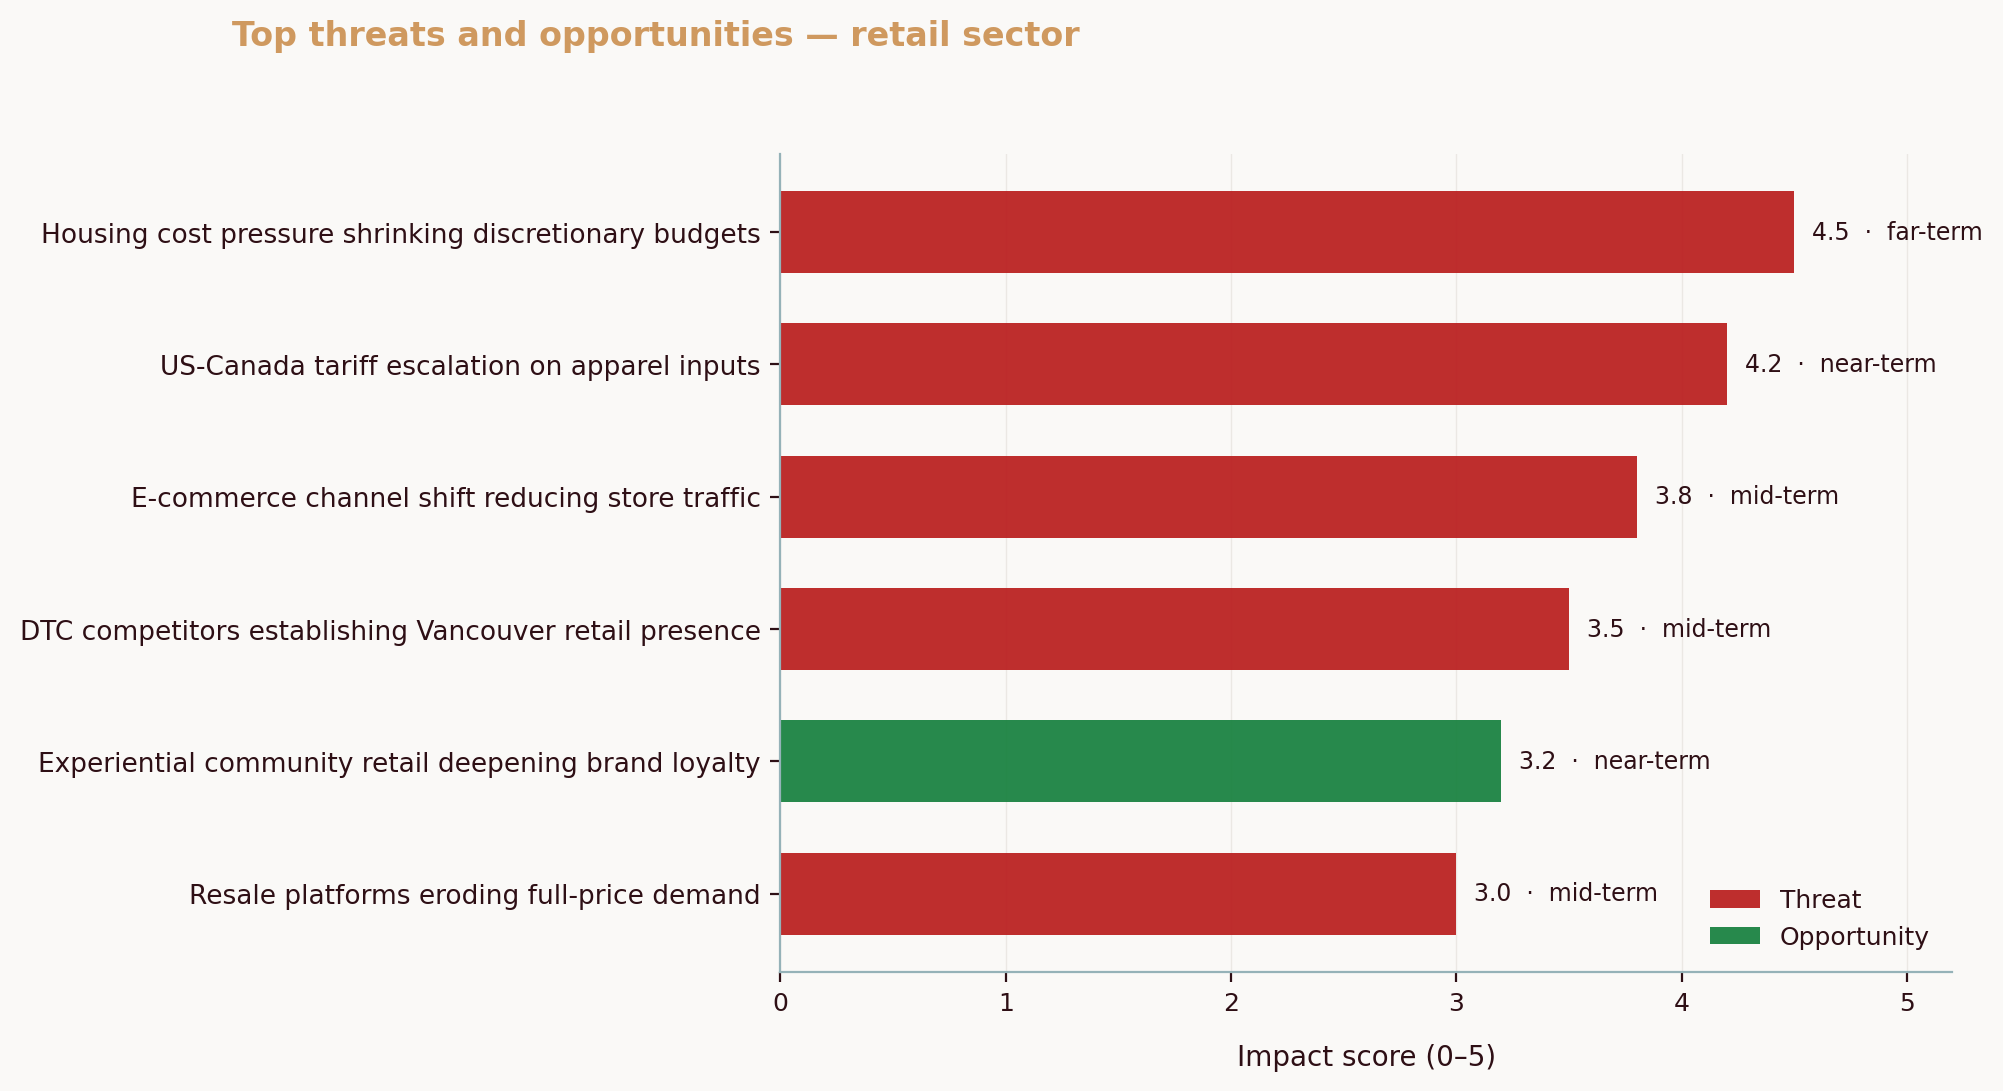
Proprietary signals from the field underscore how local and specific these advantages can be. In our analysis of a Calgary custom metal fabrication business and a Vancouver athletic wear retailer, conducted via the Aurevon Intelligence Service (March 2026), we found two patterns: in Calgary, saturated five star reviews shifted the battleground to content visibility, localized supply options, and visible technology adoption; in Vancouver, a retailer that once owned the city’s social conversation saw share erode as international chains and influencer led brands pressed in at once, with price perception as a persistent drag. When the fight moves from quality to visibility and value, measurement becomes survival.
What does this mean for you? Pick one decision you make often that feels fuzzy. For example: “Which promo should I run next weekend?” Before, you glance at last month’s revenue and go with a gut favorite. After, you stack promos by net margin lift, layer in channel attribution, and choose the one that wins in the data. Before: a guess. After: a bet with odds you can explain.
If competition clarity is the blocker, map your rivals by actual customer overlap instead of assumptions. This guide helps you do it in an afternoon: How to Identify Your Real Competitors (Not Who You Think They Are). That map turns into a plan when you pressure test strengths and weaknesses with a simple framework: How to Do a Competitor SWOT Analysis for Your Small Business. See the difference?
To reinforce the payoff, frame the habit like this: data-driven decisions small business leaders can act on, reviewed weekly, compound faster than sporadic gut checks.
Common BI Tools and Technologies
You don’t need enterprise software to get moving. Modern BI tools fall into a few approachable buckets:
- Lightweight dashboarding: Google Looker Studio (formerly Data Studio) connects quickly to Google Analytics, Sheets, and many third-party sources. It is free to start, with paid connectors when you need them.
- Analyst-friendly platforms: Microsoft Power BI and Tableau offer rich modeling, beautiful visuals, and plenty of tutorials. Both have low-cost per-user plans and trials.
- Open-source options: Metabase and Apache Superset are solid choices if you want control and no per-seat fees, though you will invest a bit more in setup.
- All-in-one SMB suites: Zoho Analytics or similar tools bundle data prep, reporting, and AI-assisted insights in one place, helpful when you lack dedicated analysts.
Here’s a quick snapshot to help you shortlist:
| Tool Name | Key Features | Pricing | Best For |
|---|---|---|---|
| Google Looker Studio | Fast dashboards, Google-native connectors, shareable links | Free core; paid connectors available | Owners who want quick, low-cost reporting |
| Microsoft Power BI | Strong data modeling, DAX formulas, desktop + cloud | Low-cost per user with trial | Teams ready to standardize KPIs in one place |
| Tableau | Rich visuals, strong community, flexible data blending | Per-user subscription with trial | Visual storytellers and exec-facing dashboards |
| Metabase | Open-source, SQL and no code questions, scheduled emails | Free self-hosted; paid cloud tiers | Tech savvy SMBs avoiding per-seat costs |
| Apache Superset | Open-source BI, custom viz, role-based access | Free self-hosted | Companies with in house dev/IT support |
| Zoho Analytics | Integrated suite, automated insights, many connectors | Tiered plans with trial | Owners who prefer one vendor for many tools |
💡 Pro Tip
Start with a free trial and a single, decision-tied dashboard. If the tool helps you answer that one question faster every week, keep it. If not, switch quickly before you build sunk-cost bias.
Tools are only half the job. You still need timely inputs. If competitor moves drive your marketing, schedule a weekly pass to capture offers, prices, and messaging. This walkthrough shows easy, no-cost methods: How to Track Competitor Pricing and Marketing Without Expensive Tools. Treat these scrapes as a sensor feeding your dashboard.
Bridge this section to action by setting a constraint: no more than five top-level metrics on any page. If everything is a priority, nothing is.
Implementing BI Solutions
A simple roll out plan keeps momentum high and risk low.
1) Frame one decision. Write it as a question: “Which five products deserve feature placement next month?”
2) Inventory data. List the systems that touch that decision: POS, ecommerce, ad platforms, email, social, and any competitor notes.
3) Standardize names. Align product IDs, campaign names, and date formats so joins work. Ten minutes here saves hours later.
4) Pick a starter tool. Use the table above to choose a platform that matches your skills and budget.
5) Build a minimum viable dashboard. One page. Five metrics: revenue, margin, traffic or footfall, conversion, and average order value. Add one dimension that matters, like store, region, or channel.
6) Validate with a test. Make one change based on the dashboard and log the outcome. Repeat weekly.
7) Train the team. A 30 minute standing review each week is enough. Ask “What surprised us? What do we change?”
8) Document definitions. A sentence per metric lives in the dashboard. Kill arguments before they start.
9) Automate refresh. Set scheduled data pulls so the dashboard is ready before your weekly review.
Common friction points arise. Data quality drags decisions when duplicates and missing values sneak in. A tidy rule helps: no decision comes from a metric without a documented definition and source. Another friction point is overbuilding. If a request doesn’t tie to your one decision question, put it in a “later” list. Scarcity is a feature.
A quick “do this today” exercise: export 12 months of sales by product and channel from your POS or ecommerce platform. In your BI tool or a spreadsheet, create a small chart that shows two things: sales rank and return rate for the top 20 SKUs. Flag any product in the top ten for sales with an above average return rate. Decide whether to fix, reposition, or drop those items in the next cycle. Small action, real dollars.
As your competitive context evolves, layer in structured views: a lightweight competitor map from this field guide, How to Identify Your Real Competitors (Not Who You Think They Are), followed by a refresh of your strengths and exposures using How to Do a Competitor SWOT Analysis for Your Small Business. Those snapshots plug straight into your monthly review.
Case Studies and Success Stories
Consider a hypothetical Halifax accounting firm. Before BI, partners spent every Friday arguing over “pipeline feel,” while junior staff juggled spreadsheets. After implementing a simple dashboard that joined CRM stages with website inquiry sources, they learned that webinars converted three times better than generic blogs, but only when followed by a personal follow up within 48 hours. The firm shifted budget from ads to quarterly webinars and added a two touch sequence. New client bookings rose without adding headcount. Clean and simple.
Now anchor this with real competitive dynamics from Canada’s main streets. In the Calgary custom metal fabrication market we analyzed earlier, review scores were uniformly high, so “quality” wasn’t a useful signal anymore. BI shifted the lens to content visibility, supply chain localization, and proofs of technology adoption in bids. Shops that showed CNC automation clips and local supplier depth rose in shortlists, a reminder that the right metric is sometimes “share of attention,” not just “average rating.” In Vancouver’s athletic wear scene, the retailer’s dominant voice slipped as international competitors and influencer brands chipped away across multiple channels at once. A weekly social share dashboard exposed where conversations were shifting, and a targeted pricing and creator partnership test won back ground. When your advantage changes, your metrics must change with it.
A restaurant owner in Saskatoon faces a different squeeze: value, safety, and vibe, all at once. Translating that “triple pressure point” into BI terms yields three dashboards: menu margin by item and time of day, safety incident tracking with root causes, and atmosphere proxies such as dwell time and repeat visits on game nights. One screen won’t fix margins, but three focused screens can point to which lever to pull first.
External research supports this operational focus. BDC’s productivity work urges entrepreneurs to invest in tech and process so they can scale output with the same people, a mindset shift that pairs naturally with BI’s “measure then improve” cadence. If you treat BI as an operating system for decisions, each week gets a little calmer, and results stack up. (https://www.bdc.ca/en/about/mediaroom/news-releases/bdc-finds-clue-missing-piece-canadas-productivity-puzzle)
If you want deeper playbooks around competitive moves, keep these at hand: How to Track Competitor Pricing and Marketing Without Expensive Tools and the broader strategy lens here, How to Do a Competitor SWOT Analysis for Your Small Business. For trend spotting that feeds your roadmap, add this primer: Small Business Market Trend Tracking Guide, and when you are ready to visualize the essentials, use Build Your First BI Dashboard for Small Business.
Common Questions About Business Intelligence for Small Business
How can small businesses benefit from business intelligence?
Start with the decisions you make often: pricing, staffing, and promotions. BI helps you see which products carry margin, which hours deserve staff, and which channels actually convert. The gains compound: one MIT study linked data driven decision making with 5% to 6% higher productivity, which, at small scale, is the difference between funding a hire or freezing growth. (https://papers.ssrn.com/sol3/Delivery.cfm/SSRNID1968725code1376648.pdf?abstractid=1819486&mirid=1&type=2)
What are some affordable BI tools for small businesses?
Good entry points include Google Looker Studio (formerly Google Data Studio), Microsoft Power BI, and Tableau Public. Each offers a low or no cost path to build your first dashboard and connect to common sources like Sheets, CSVs, or cloud apps. If you need affordable business intelligence small business teams can run without extra headcount, start with these and upgrade only when the use case proves out. Since many Canadian firms already use cloud tools, connecting them for reporting is usually fast. (https://www150.statcan.gc.ca/n1/daily-quotidien/240917/dq240917c-eng.htm)
Is implementing BI complex for small businesses?
It can be simple if you shrink the scope. Frame one decision, collect only the data that feeds it, and build one page. Many tools ship with templates and trials, and Canada focused guidance shows that technology adoption is already improving efficiency for firms that act deliberately. (https://www150.statcan.gc.ca/n1/pub/11-621-m/11-621-m2024008-eng.pdf)
Can business intelligence help in improving customer relationships?
Yes. A basic lifecycle view (first touch, conversion, repeat) reveals where customers drop off so you can fix handoffs. Even a weekly check on response times and post purchase feedback moves satisfaction in the right direction. Larger businesses are pulling ahead with advanced analytics, but the core wins come from consistent measurement and quick adjustments. (https://businessdatalab.ca/publications/prompting-productivity-generative-ai-adoption-by-canadian-businesses/)
What is business intelligence in simple terms?
It is a way to turn the data you already have into clear choices, using organized information and plain English visuals so you can act with confidence.
How much does business intelligence cost?
You can start for free with basic tools, then expect a modest monthly spend as you add users, connectors, and automation. Most small businesses begin under a few hundred dollars per month for software, plus a few hours of internal time to build a first dashboard. One time setup help, if you choose it, is commonly a few thousand dollars, not tens of thousands.
How do small businesses use data?
They track a short list of KPIs, match them to decisions, and run simple tests. Examples include scheduling staff to actual peaks, pausing high spend ads that do not convert, adjusting prices on SKUs with high returns, and refining local SEO using search terms and Google Maps footfall patterns.
What are the 4 types of business reports?
A practical BI view breaks reports into four buckets: operational reports for daily activities, analytical reports for trends and exploration, strategic reports for goal tracking and planning, and compliance reports for audits and regulatory needs.
Aurevon’s Ecosystem Dynamics Report distills competitive, market, and trend signals into plain English insights you can act on this quarter. If you want a focused read on where to win in your category, explore the Ecosystem Dynamics Report.
Mitchell Ozmun
SMB Researcher, Business Analyst - Saskatchewan Born and Raised