5 Ways Free Public Data Can Transform Your Location Strategy: free data for business location decisions you can act on
The quote lands. Four figures for a “market study.” Another invoice for “competitive landscape.” A vague executive summary, light on specifics. You hesitate. The lease clock keeps ticking. Cash burn rises. There’s a better path: use free data for business location decisions and turn public information into clarity without lighting money on fire.
Here’s the unlock many SMB owners miss: the datasets behind pricey reports are often public. Statistics Canada profiles surface real neighborhood demographics. Google Maps reveals competitor density and rough foot-traffic rhythms. Municipal open data portals publish traffic counts, zoning, even building permits. Canada Post’s planning tool shows postal-route demographics. Google Trends maps regional demand signals. With a few smart searches and a repeatable workflow, you can assemble a clearer, cheaper picture than a one-off report and answer what most owners are really asking, where can I find free data about an area, which public data sources are credible, and which free market research tools actually help.
1) Understanding the Value of Public Data
Location choices make or break small businesses. For retailers, cafés, clinics, and gyms, the difference between a sustainable store and a cash drain can come down to the five-block radius you choose. Strong site selection blends who lives and works nearby, how they move, what they search for, and who else is already competing for their attention. Public data covers these questions better than most people think and it is ideal for quick demographic research you can repeat.
Here’s the surprising part: many paid market studies summarize public sources you can pull yourself. They add formatting, a few charts, and a steep markup. Before, you wait weeks and pay thousands to learn that a neighborhood skews mid-income with lots of renters and three entrenched competitors. After, you spend two focused hours and learn the same, plus the permit pipeline shows a new apartment tower two blocks away. That future foot traffic matters.
Why trust these sources? Government datasets are collected with consistent methods and transparent definitions. Statistics Canada’s Census of Population, for example, is the backbone for Canadian planning and policy, and its “Census Profile” tool lets you drill from provinces to micro-neighborhoods with documented variables like median income and age distribution. You can read the method notes yourself, then decide how much confidence to place in each metric. If you want the details, start at the Census Profiles landing page and follow the documentation links from there (see the official overview at Statistics Canada, Census Profile).
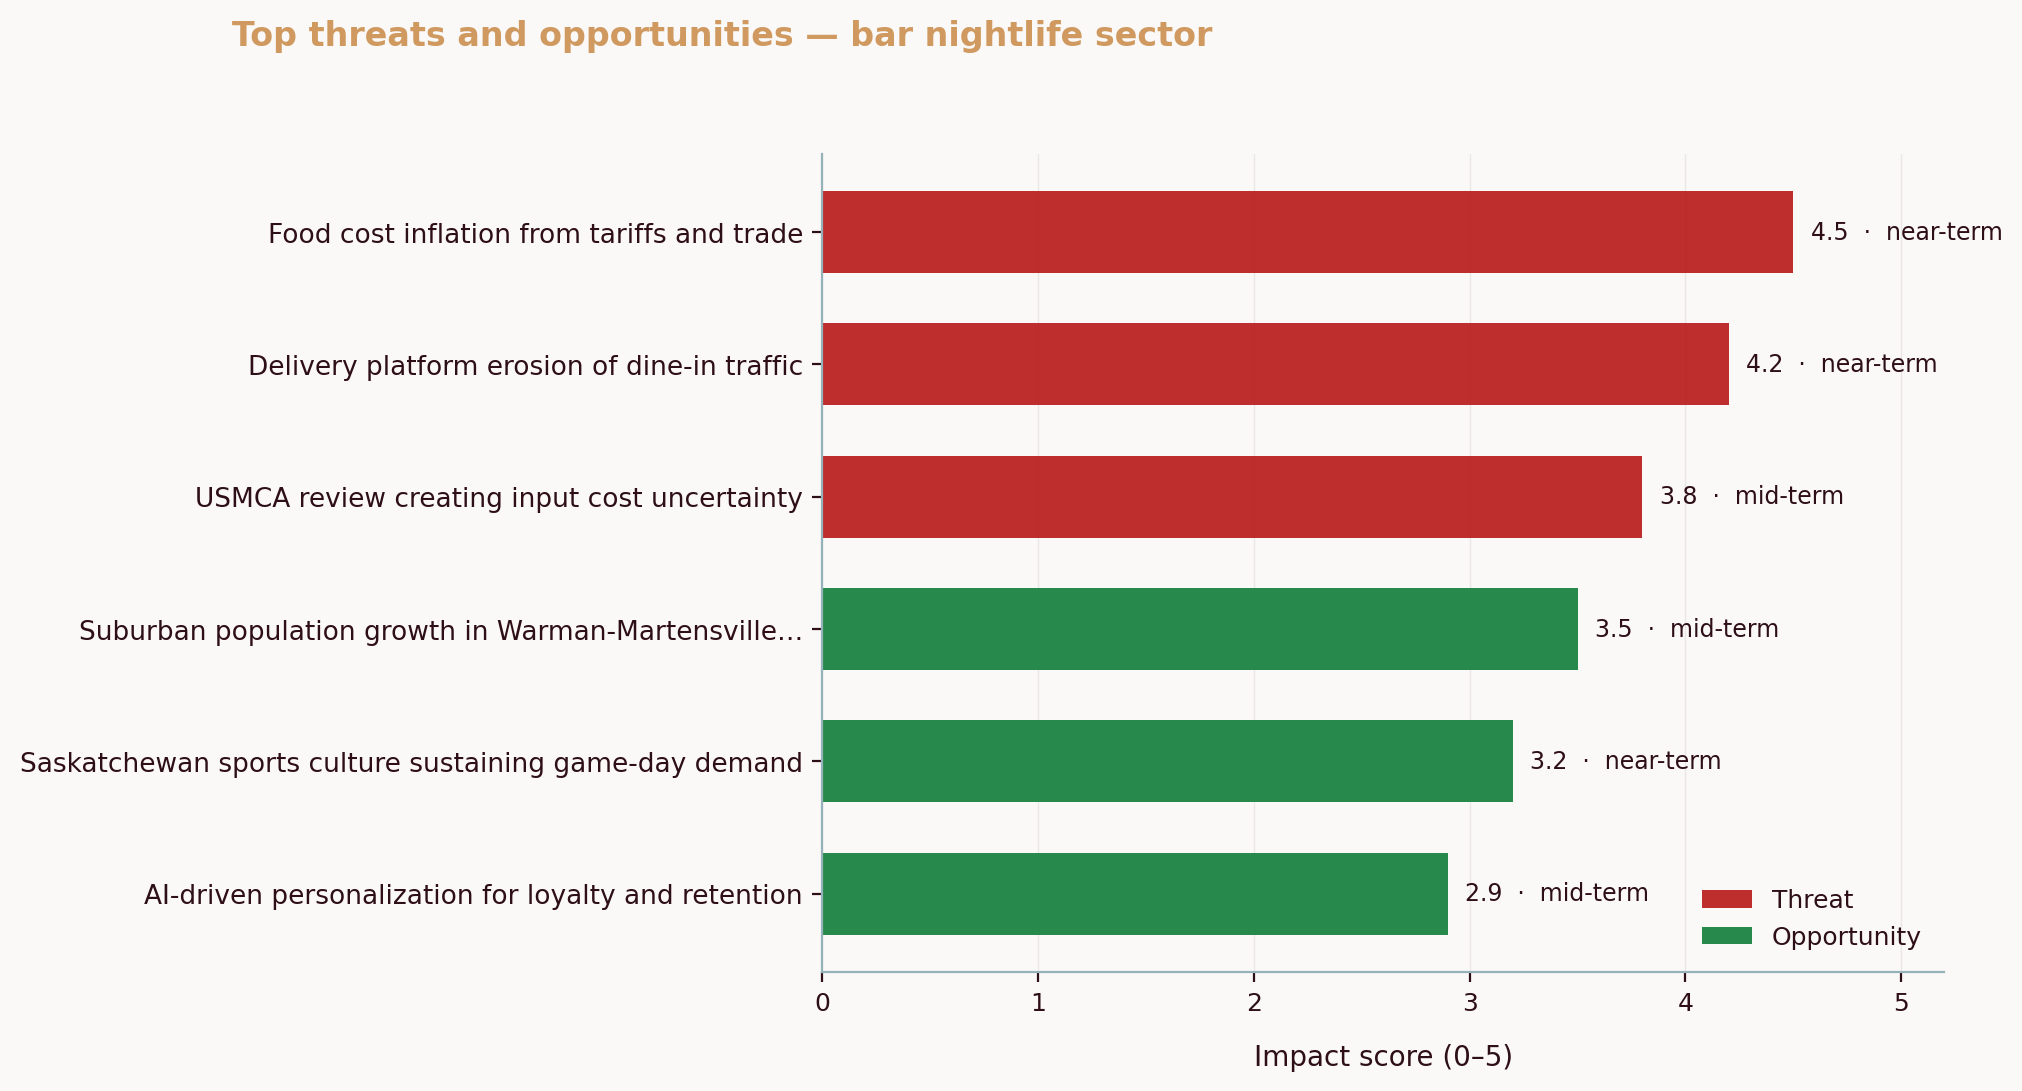
Public data also helps you think like a competitor. Across one Canadian nightlife SMB analyzed via the Aurevon Intelligence Service in March 2026, we found Saskatoon diners demanding a tough mix: sharper value, stronger food safety signals, and livelier atmospheres at the same time. That triple pressure forces owners to pick micro-locations where the promise matches the street, value corridors, clean and visible spaces, and the evening energy that atmosphere needs. Location is strategy, not just an address.
If you’re worried DIY means “guesswork,” don’t be. The better mindset is “assemble the truth from multiple angles.” Think of public datasets as camera lenses. One shows demographics, another shows movement, a third shows intent. You don’t need one perfect lens. You need a sharp composite.
So the risk is real, poor locations drain cash quietly, month after month. What can you do about it? Start with the five free sources below and a simple rule, always triangulate.
2) Overview of Key Free Data Sources
Let’s map the toolset you’ll use. The goal is not to memorize every portal. It’s to know what questions each source answers so you can assemble evidence quickly. If you are asking where to find free data about an area, start with this short list.
Statistics Canada Census Profiles. This is your demographic backbone. The tool lets you view population size, median total income, age bands, household types, education levels, and commuting modes from the province level down to dissemination areas, which are a few city blocks. Use it to size resident demand, check income fit, and see if your concept matches local life stage. Start here, Statistics Canada, Census Profile. If you are wondering how to use census data for business, this is the fastest path to neighborhood-level facts.
Google Maps. Maps doubles as a living directory and a soft proxy for street energy. Search “bakery near H2X 1Y4” or your postal code. Pan the map, toggle “Search this area,” and scan the mix of chains and independents. Open listings and study “Popular times” for daily peaks and “People typically spend” for dwell time. It’s not a scientific foot-traffic count, but it’s a useful heartbeat. Open the tool at Google Maps.
Municipal open data portals. Cities publish traffic volumes, zoning, planning applications, bike lanes, sidewalks, transit routes, and parking. These shape who passes your door and when. Typical portals include Toronto Open Data, Vancouver Open Data, and Calgary Open Data. The federal discovery portal, often called Open Data Canada, also links out to many municipal datasets.
Canada Post Precision Targeter. This free planning tool helps you explore postal-route demographics for direct mail, including household counts and selectable audience attributes. It’s designed for mail campaigns, but the same data hints at neighborhood composition by route, which is useful for quick screening. Start at Canada Post for Business and launch Precision Targeter from the marketing tools section.
Google Trends. Trends shows relative search interest over time by region for the exact terms your customers use. Compare “bubble tea” versus “smoothie bar,” narrow to Canada, then click “Subregion” or “Metro” to see where interest clusters. It’s a fast way to avoid launching a concept that peaked last year. The tool is here, Google Trends. If you want free market research tools that capture intent, start here.
Why these five together? Because they map to the decisions that matter. Census tells you who is there. Maps shows who you’ll face. City portals reveal the physical flows and rules. Postal-route data refines neighborhood texture. Trends captures intent. It’s like building a five-layer map, each layer filters noise from the last.
If you want to deepen the competitive angle as you scan Maps, this guide on pinpointing true rivals will help you separate noise from signal: How to Identify Your Real Competitors (Not Who You Think They Are).
3) Step-by-Step Guide to Using Each Data Source
You don’t need a researcher’s toolkit. You need a focused checklist. Here’s the play-by-play, including exactly what to click and how to read the results. Along the way this answers how to check demographics of a neighbourhood and how to use census data for business in practical steps.
1) Statistics Canada Census Profiles
- Go to Statistics Canada, Census Profile.
- In “Location,” start broad with your city. Use “Geographic type” to switch among “Census subdivision (municipality),” “Census tract,” or “Dissemination area.” For site selection, census tracts or dissemination areas are the sweet spot.
- In the results, scan “Population,” “Median total income,” “Age characteristics,” and “Mobility and migration.” Click through variable definitions if any label is unclear.
- Make a short table, neighborhood A vs neighborhood B. For each, jot population count, share of 20–39-year-olds, median total income, renter share, and transit-to-work share. These variables quickly sketch daypart potential and spend capacity.
- Interpretation tip: If the renter share is high with strong 20–34 density, early evening foot traffic may outpace mornings. A family-heavy tract with higher income might reward a premium ticket size and daytime convenience.
Reference method notes if you want to understand the confidence behind each metric. The data dictionary and definitions are linked from the Census Profiles pages, and the agency explains how variables are constructed. For a practical view on why market research fundamentals matter, the Business Development Bank of Canada has accessible primers that hold up well, see BDC, Market research 101.
2) Google Maps for Competitor Mapping
- Go to Google Maps and type “[your concept] near [postal code or address].” Example, “coffee near S7K 0A1.”
- Click “Search this area” after you pan or zoom to your short list neighborhoods.
- Open each listing that looks like a real competitor. Note chain versus indie, star rating patterns, number of reviews, and the “Popular times” graph. That hourly curve becomes your proxy for when the area actually moves.
- Create a simple competitor map. You can use Google’s “Save” to star important locations, or build a quick spreadsheet with distance from your candidate address, the competitor’s positioning (e.g., drive-thru, third-wave, bakery-café), and observed peak times.
- Interpretation tip: Four stores clustered within 250 meters with similar menus signals red ocean risk. A gap in evening peaks may mean neighbors skew early morning commuters. That affects your staffing plan and your closing hour.
If you’re unsure who actually counts as a competitor, tighten your lens with a quick framework: How to Identify Your Real Competitors (Not Who You Think They Are). Then, pressure-test your read with a fast competitor SWOT so your choice of location aligns with a defendable strength.
3) Municipal Open Data Portals
- Search “open data portal [your city]” and click the official site, such as Toronto Open Data, Vancouver Open Data, or Calgary Open Data.
- Use the site search for “traffic volume,” “bicycle counts,” “pedestrian,” “zoning,” “development applications,” or “building permits.” Many portals have ready-made maps.
- Example, Toronto publishes “Traffic Volumes at Intersections,” which reveals turning counts and total vehicles by location. Vancouver lists “Development Applications,” letting you spot future density near a potential site.
- Export CSVs if available. If not, screenshot the map and annotate it. Focus on the blocks around your potential storefront and the nearest arterial roads.
- Interpretation tip: A site may look quiet but sit between two growing nodes. If permits cluster east of you, you may be choosing the wrong side of the future. Choose the on-ramp, not the off-ramp.
4) Canada Post Precision Targeter (Postal-Route Demographics)
- Begin at the business portal, Canada Post for Business. Search for “Precision Targeter,” then launch the tool.
- Enter the candidate postal code, set your target audience filters (e.g., household type, age ranges), and view postal routes shaded by fit.
- Click routes to see household counts and audience matches. Export the route map if you want a quick overlay for your deck.
- Interpretation tip: Routes are not the same as census tracts, so don’t mix them blindly. Use them to stress-test whether a few blocks over would put you in a pocket with more of your ideal buyers.
5) Google Trends (Regional Demand Signals)
- Go to Google Trends.
- Set Region to “Canada,” Time Range to “Past 12 months” (or “5 years” for seasonality).
- Compare “coffee shop,” “cafe,” and “espresso” or terms that fit your concept.
- Click “Interest by subregion” and “Metro” to see where interest concentrates. Download the CSV if you want to build a small chart.
- Interpretation tip: A rising trend in your province helps, but metro-level signals matter more. If your term’s interest is flat citywide but growing in a nearby suburb, your ideal block may be outside the core.
As you cross-reference these sources, weave in competitive behavior. In that March 2026 nightlife intelligence report for a Saskatoon bar, the binding pattern was a three-way squeeze, value sensitivity, visible safety, and a search for atmosphere. What does that mean for location? If a micro-district is price-conscious and cautious, pick a corner with strong sightlines, clear hygiene cues, and neighbors that draw an evening crowd so your vibe does not have to do all the work alone.
Now, cement this workflow with a quick comparison to keep you oriented.
Data Source | Key Features | Best Use Case
- -- | --- | ---
Statistics Canada Census Profiles | Demographics by tract or dissemination area; income, age, household types, commuting | Validate neighborhood fit and spending power
Google Maps | Competitor density, “Popular times,” dwell hints, reviews | Spot saturation, estimate dayparts, refine positioning
Municipal Open Data Portals | Traffic counts, zoning, permits, bike lanes, transit | Understand flows and future density, avoid zoning snags
Canada Post Precision Targeter | Postal-route household counts and audience filters | Micro-target resident mix and route-level pockets
Google Trends | Relative search interest by region and time | Gauge concept demand and seasonality by metro
💡 Pro Tip
Always cross-reference two or more sources before you decide. If Census suggests strong 25–34 density, check Maps’ evening peaks and the city’s development permits. Agreement builds confidence. Disagreement is a red flag to investigate.
Do this today, block 30 minutes to run your top postal code through Census Profiles, star three direct competitors on Google Maps, and pull your city’s traffic volume layer. You’ll be surprised how quickly a “maybe” block turns into a strong yes or a clean no.
For continuous competitor monitoring once you shortlist a site, this practical guide shows how to track pricing and promos with free tools: How to Track Competitor Pricing and Marketing Without Expensive Tools.
4) Worked Example Using the Data Sources
Let’s test the method with a hypothetical, you’re opening a specialty coffee bar in Saskatoon. Two candidate areas emerge, a lively riverside district near galleries and a suburban retail node with ample parking. Which one sets you up for repeat revenue?
Start with Census Profiles. Search Saskatoon, then click through to census tracts around each block. In the riverside district, you notice a higher share of 20–34-year-olds, more renters, and above-average transit or walking to work. In the suburban node, household sizes are larger, median income is slightly higher, and car commuting is dominant. You translate this into a simple hypothesis, downtown favors later afternoons and evenings, suburban favors early mornings and weekends.
Open Google Maps. Search “coffee near [postal code]” for each area. The downtown cluster has four third-wave cafés within a short walk, but “Popular times” reveal a pronounced late afternoon bulge and steady evenings, hinting at gallery and river traffic. The suburban node shows two drive-thru chains with sharp 7–9 a.m. peaks and softer afternoons. That’s a signal. If your menu leans toward sit-and-sip with pastry pairings, the downtown rhythm fits your dwell-time goal. If you want volume at 8 a.m., the suburban node wins.
Now pull the municipal open data. On Saskatoon’s portal, look for development and traffic. You spot a planned mid-rise residential project two blocks from the downtown site and a bike lane extension slated for the river corridor. The suburban node shows strong vehicle counts on the main arterial, but fewer pedestrian amenities. Future density near the downtown site suggests a rising base of regulars, which compounds over time.
Add Precision Targeter. You scan postal routes adjacent to each address. Near downtown, several routes align with younger adult profiles and smaller households. Near the suburban site, route data points to families and higher vehicle ownership. You don’t treat route data as gospel, but it backs the Census story.
Finish with Google Trends. Compare “espresso,” “pour over,” and “decaf coffee” nationwide, then narrow to Saskatchewan. Seasonality shows winter spikes for “decaf coffee” and steady interest for “espresso.” You translate that into a winter menu tweak and a staffing plan for the darker months. It’s not about chasing the trend. It’s about not missing a known curve.
Now apply a local lens. In that March 2026 nightlife report for a Saskatoon bar, the squeeze of price sensitivity, safety expectations, and the hunt for atmosphere stood out. Downtown, sightlines and cleanliness cues from street to bar counter matter. A small frontage with warm lighting and visible sanitation fits the safety piece, while the surrounding galleries lift the atmosphere without extra spend. In the suburban node, price signals dominate, and a drive-thru competitor sets convenience expectations you’ll need to beat or avoid.
Decision time. You weigh both options with operational reality. The downtown block likely supports higher ticket sizes with later peaks and nearby cultural draw. The suburban node offers commuter volume but forces a speed game against entrenched chains. If your concept banks on craft and dwell time, the downtown site has the stronger strategic fit. If your concept banks on throughput, choose suburban—then design the service line to crush morning peaks.
See the difference? You didn’t guess. You stacked five free lenses and read the composite.
If you want to move from raw observations to a plan, a quick SWOT anchored in your chosen block helps lock the choice: How to Do a Competitor SWOT Analysis for Your Small Business.
5) Limitations of Free Data and When to Invest in Paid Research
Free sources have edges. Census data lags by design, and neighborhood dynamics can shift faster than a multi-year cycle. Google Maps’ “Popular times” reflects sampled behavior and can skew by season. Municipal portals vary in quality and freshness. Canada Post’s route profiles are great for mail planning, but they’re not a replacement for on-the-ground counts. Google Trends is relative, so “100” in one metro is not the same as “100” in another.
When does paying make sense? Three cases stand out. First, when you need forward-looking forecasts, such as trade area modeling with mobile mobility data or gravity models that simulate store cannibalization. Second, when your bet is large and a bad call would endanger the company. Third, when compliance or specialized permitting requires expert review. In those cases, bring in professionals or procure paid datasets, and anchor them to your public-data base. For broader context on why combining primary and secondary research pays off, BDC’s market research guidance remains a solid primer, see BDC, Market research 101. If you need to expand your search beyond city portals, Canada’s federal hub is a strong index of additional resources, explore Open Data Canada. If you want more texture on small business conditions as you plan timing, CFIB’s research snapshots provide helpful signals, see Canadian Federation of Independent Business, Research.
Common Questions About Using Free Public Data for Business Locations
What types of businesses can benefit from using free public data?
Any location-dependent business gains from this playbook. Retailers build a customer base from people who live, work, or pass nearby. Service businesses, from salons to auto repair shops, match their offer to neighborhood composition and travel patterns. Even B2B outfits can choose between warehouse districts and mixed-use areas based on truck access and workforce commute modes. The common thread is simple, public data shows who is there, how they move, and what they signal they want. If foot traffic, visibility, or proximity to target customers matters, these sources shorten the odds in your favor.
Is the data from public sources reliable?
Yes, within its purpose. Government data is gathered with defined methods and audited processes, and the underlying questionnaires, variables, and sampling approaches are transparent. That transparency is a feature, you can read precisely what “median total income” means before you use it. Reliability also comes from triangulation. If Census signals an income band, Maps shows a peak daypart, and the city lists a coming transit upgrade on your block, you have three independent reasons to believe your site makes sense. Treat each source like a witness whose testimony you cross-check with others.
How can I ensure I’m interpreting the data correctly?
Slow down and define the decision first. Are you choosing between two blocks or greenlighting a whole neighborhood? Then pick three variables that matter most for your concept, say, young adult share, competitor density, and evening peaks, and read only those at first. When something conflicts, go to the method notes or the metadata page and see how the number was defined. Add a 30-minute walk around the block at your target time of day to ground-truth the patterns you think you see. If stakes are high or the signals are mixed, get a second pair of eyes from a mentor or a professional analyst. And remember, your goal is to reduce uncertainty, not to prove a hunch.
When should I consider investing in paid research?
As the dollars at risk increase, so does the value of precision. If your model hinges on capturing a narrow commuter flow at specific times, a paid mobility dataset can confirm whether those flows exist year-round. If you need to forecast revenue for multiple potential sites across a region, advanced models and proprietary datasets earn their keep. And if you’re navigating strict permitting, specialized zoning, or public health rules, professional help can save months. Consider paid research when it changes a go/no-go decision or meaningfully shifts lease terms, buildout plans, or staffing.
A quick, brand-agnostic next step, block ninety minutes this week to run the five-source workflow on one real postal code you’re considering. Take screenshots, paste them into a single doc, and jot one sentence beneath each on what it means. That packet becomes your decision brief.
If you want help turning public signals into an integrated, Canada-specific location brief without hiring consultants, Aurevon’s Ecosystem Dynamics Report distills these sources and more into an actionable package tailored for SMBs. See what that looks like here: https://aurevon.ca.
Mitchell Ozmun
SMB Researcher, Business Analyst - Saskatchewan Born and Raised