What Is Business Intelligence? Essential Insights for 2026
You’ve felt the squeeze. Sales wobble. Competitors crowd your feed. A big-box rival launches a promo that undercuts your margin by a dollar. The reflex is to react. The smarter move is to see it coming.
Here’s the plain answer to what is business intelligence: it’s the habit of turning the data your business already has (and can cheaply access) into actionable insights and decisions you can defend. In practice, BI collects, organizes, analyzes, and presents information so you can answer concrete questions like “Which products drive repeat visits?” or “Where are we losing carts?” If you’re an SMB owner, that’s not a luxury. It’s how you reclaim control in a noisy market.
Think of BI as turning on high beams on a dark highway. You still drive the car. You just see farther.
Related: What is Business Intelligence (BI) — GROW
What Is Business Intelligence?
If you want business intelligence explained simply, start with one sentence: BI means using your operational data and market intelligence to understand what happened and what’s happening, then acting on it. No buzzwords required.
So what does that look like for smaller firms, in practical business intelligence examples?
- A neighborhood restaurant watches competitor reviews and menu changes. When nearby diners begin raving about family-style options, the owner tests a sharable platter and sees weekend ticket size jump. This isn’t spying; it’s reading public signals and responding with intent.
- A retailer tracks foot traffic by hour across two locations. After seeing a Tuesday dip that coincides with a rival’s “Two for Tuesday” push, the manager pairs a timed loyalty bonus with staff reassignments. Weekday conversion climbs. Staff stress falls.
- A service business (say, a home repair company) monitors market chatter and industry bulletins. When local posts about building code updates spike, the owner runs a quick preemptive compliance check, shares a short “What changed” explainer, and earns inbound calls before competitors wake up.
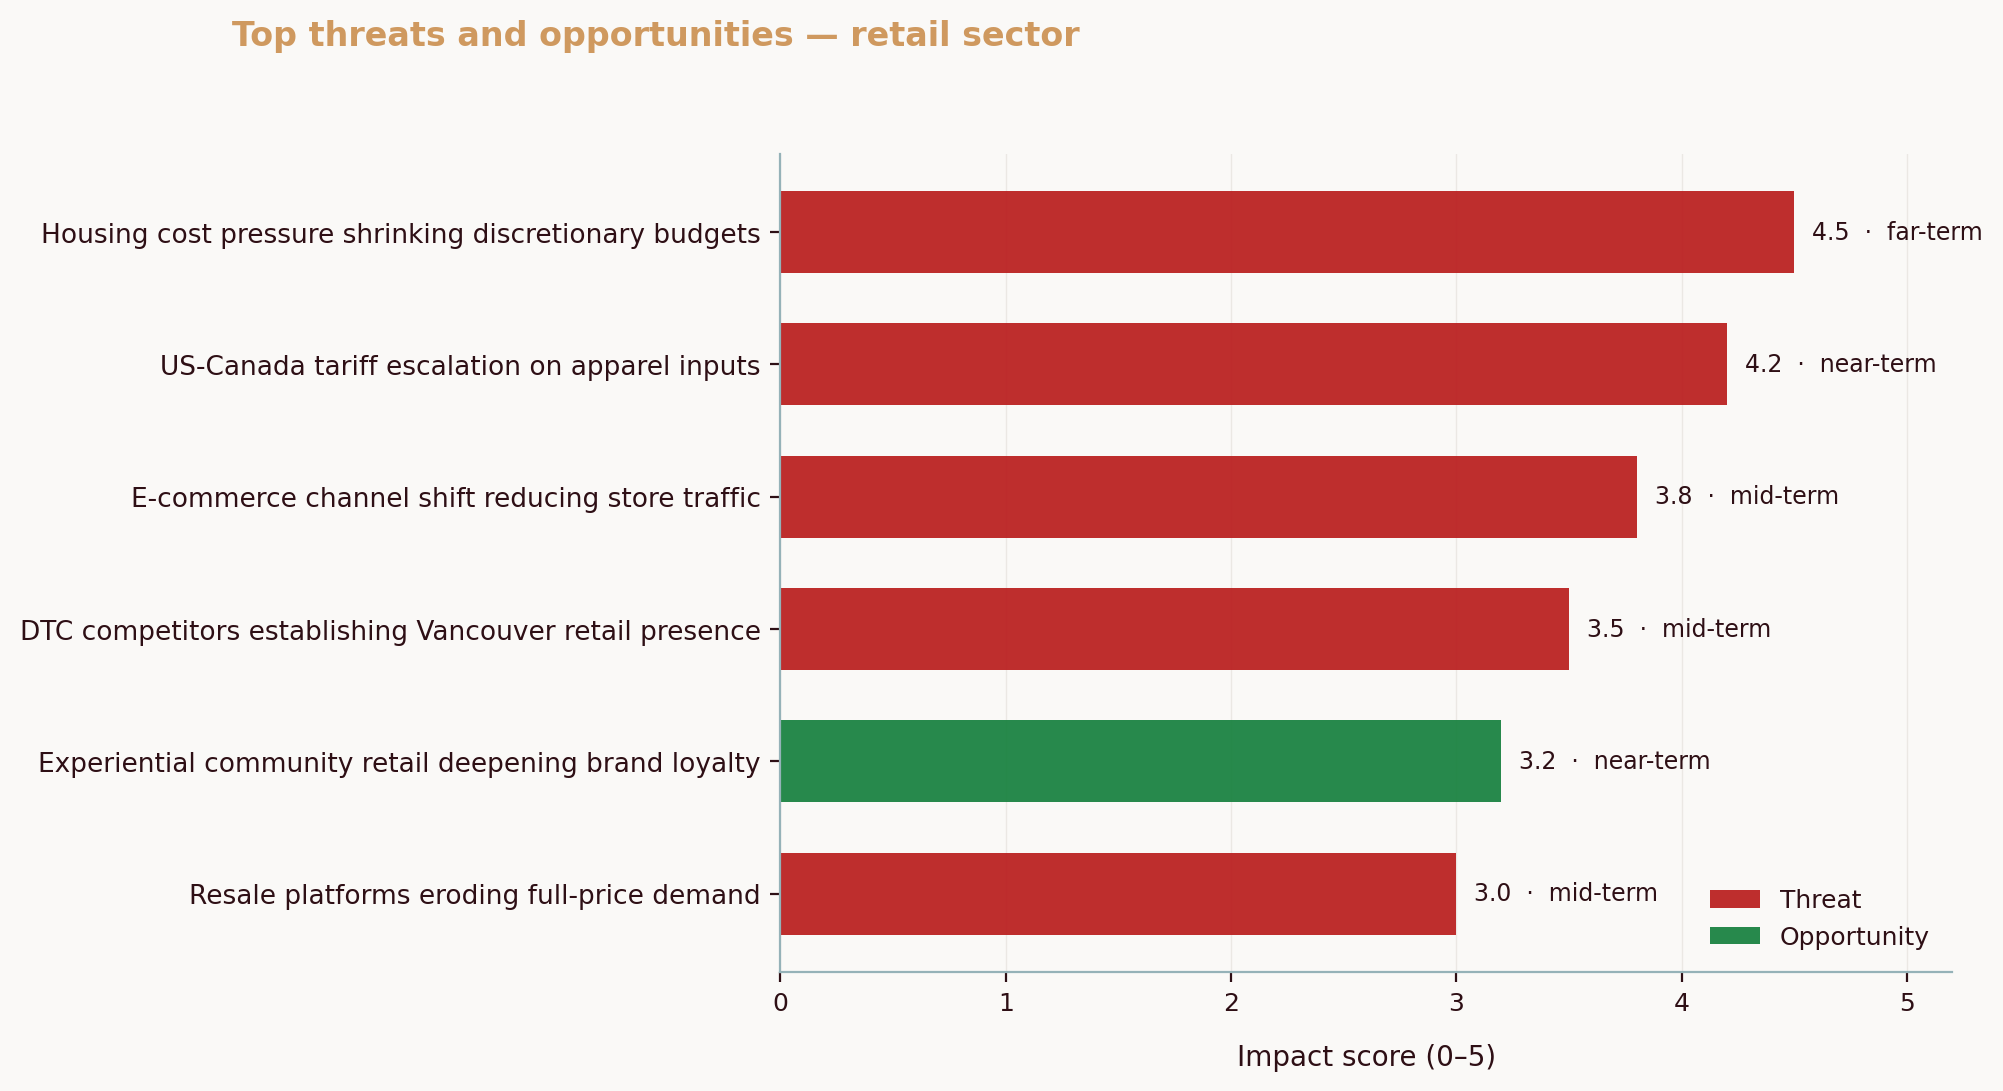
Across Canadian SMBs we’ve analyzed via the Aurevon Intelligence Service (March 2026), one pattern keeps repeating: the battleground is shifting to visibility and timing. In a Calgary custom metal fabrication market saturated with near-perfect online ratings, wins flow to firms that publish more proof of localized supply chains and show visible adoption of technologies like CNC automation and AI-enabled welding. In Vancouver athletic wear, a retailer’s once-dominant share of social mentions is being eroded in parallel by global entrants on Robson and Metrotown and by influencer-led brands that pressure premium pricing. In Saskatoon nightlife, diners now demand better value, stricter food safety cues, and more compelling atmospheres at the same time, which squeezes margins unless operators change their mix. Those are three different sectors. The common thread is real-time reading of the field and fast moves to match.
Why this matters to you: Canada’s SMBs are adopting digital tools quickly, but integration lags. The Canadian Federation of Independent Business reports that while most small firms use digital tools, only a small minority have them fully woven into daily operations, which leaves growth on the table. Among digitizing firms, many see returns within two years and meaningful productivity gains in year one. That’s cash flow you can feel, not a theoretical benefit. CFIB’s media brief on digital adoption supports those figures.
If you’ve heard that BI belongs to enterprises with teams of analysts, file that under outdated. Today’s tools hide the plumbing. Some platforms like Microsoft Power BI and Tableau make it simple to build dashboards you can read at a glance. The point isn’t “more charts.” It’s confidence when you say yes or no to the next move.
With the business intelligence definition in place, let’s walk the process you can follow this quarter.
The Business Intelligence Process
BI works best as a funnel. Data starts broad, then narrows into action.
- Collect → Organize → Analyze → Act
Here’s a simple visual to keep on your wall:
Collect
↓
Organize
↓
Analyze
↓
Act
Collect. Start with what you already touch: point‑of‑sale transactions, website analytics, inventory logs, staff schedules, customer reviews, and public competitor signals and competitive data. Add one or two light external feeds where it helps (for example, downtown pedestrian counts or weather patterns if you’re in seasonal retail). The goal is coverage, not perfection.
Organize. Put data where it’s findable and consistent. That could be a shared spreadsheet with validated columns, a cloud database managed by your IT provider, or a lightweight data warehouse if you’ve outgrown spreadsheets. Label time periods the same way. Standardize product names. Decide who “owns” each data set. Boring? Maybe. But a clean shelf means faster mornings.
Analyze. Ask questions, not everything-at-once. “Which SKUs are bought together on weekdays?” “Which promo codes drive repeat purchases within 30 days?” “Which review topics predict table turns on game nights?” Start with descriptive views: trends, segments, comparisons. Visualizations should help you see outliers and patterns quickly. Think of a chart as a compressing machine for attention.
Act. Turn a finding into a test with a dollar target. If lunch conversion is 1.8% and you want 2.2%, sketch the move (new placement, time-bound offer, staff script), pick one or two locations, and set a one‑month window. Put the decision in your calendar with a rule for what counts as success. Then do it.
Here’s how this actually works. Imagine your garden center in Kamloops. You pull POS and weather data into a weekly sheet, then compare same-week sales during last year’s heat wave. You spot that early‑morning drip irrigation kits sold out on days after heat alerts. This year, you pre‑position inventory and run a 7 a.m. “Beat the Heat” bundle the morning after an alert. Before: reorder panic at noon. After: stock staged, signage ready, staff briefed, and a calm uptick in high‑margin accessory sales.
One surprise you’ll like: you don’t need to chase cutting‑edge AI to get value. Statistics Canada shows that even straightforward “text analytics”—mining reviews, emails, and survey responses—is the most common AI application among adopters, with data analytics also among the leaders. Adoption of AI by Canadian businesses roughly doubled between mid‑2024 and mid‑2025, which mirrors what many SMBs feel on the ground: practical tools are getting cheaper and easier to use. Statistics Canada analysis of AI use, Q2 2025.
With the mechanics clear, you still need to know what BI is and what it is not compared to related fields.
Differentiating BI from Business Analytics and Data Science
BI, analytics, and data science sit on the same family tree. They just solve different questions.
- Business intelligence focuses on what happened and what’s happening now. It aggregates and visualizes trusted data so managers can run the business day to day. Think dashboards, KPIs, and drill‑downs.
- Business analytics explores why performance changed and what could improve results. It adds techniques like cohort analysis, A/B testing, segmentation, and scenario planning. Still close to the ground, a bit more diagnostic.
- Data science builds predictive models and new data products. That includes machine learning to forecast demand, detect anomalies, or power recommendation engines. Powerful, yes. Often heavier in talent and tooling.
A practical analogy: BI is your instrument cluster. It tells you current speed, fuel, and engine warnings. Analytics is the trip computer that explains why your fuel economy dropped and which route saves time. Data science is the navigation system that predicts traffic and reroutes you before a jam forms.
Common misconception: “BI predicts the future.” It doesn’t. It prepares you to decide in the present, with context. That’s its edge.
See the distinctions at a glance:
| Aspect | Business Intelligence | Business Analytics | Data Science |
|---|---|---|---|
| Core purpose | Monitor and understand performance now | Diagnose change and test improvements | Predict outcomes and build data‑driven features |
| Primary questions | What happened? What’s happening? | Why did it happen? What could we try? | What will happen? What should we automate? |
| Typical outputs | Dashboards, scorecards, operational reports | Experiments, segments, scenarios, drivers | Forecasts, classifiers, recommendations |
| Data scope | Cleaned, governed historical and near‑real‑time data | Same data plus experimental and external enrichments | Full data stack, including raw and unstructured |
| Skills emphasis | Domain knowledge, metric design, visualization | Hypothesis framing, experimentation, SQL/BI | Statistics, ML, Python/R, MLOps |
| Time horizon | Days to quarters | Weeks to quarters | Months to years |
What does this mean for you? If you run a growing shop with thin margins, BI is the first win. It’s the fastest way to stop managing by hunch and start managing by evidence. See the difference?
Armed with definitions, let’s tackle the biggest pushback.
Isn’t Business Intelligence Just for Big Companies?
It used to be. Not anymore.
Three shifts changed the math for SMBs:
- Cloud pricing means you can start small and pay monthly. You’re not buying servers or long contracts for a basic dashboard stack.
- Connectors and templates slash setup time. Pulling data from your POS, ecommerce platform, or accounting system is often a few clicks, not a months‑long project.
- Usability jumped. Tools now speak the language of questions. Some platforms like Tableau focus on intuitive visuals that non‑analysts can scan and interpret. Clean beats complex.
The adoption curve backs this up. A Statistics Canada survey found that more businesses reported using AI in operations in April–May 2025 than a year earlier, with text analytics and data analytics among the most common applications. That’s another sign that “data work” is moving into everyday workflows, not just labs. Statistics Canada, Q2 2025 AI analysis.
And the payoff? CFIB’s 2025 research shows most small businesses are using digital tools, but only about one in ten have them fully integrated. Among those who do invest, many recoup quickly, and early movers report stronger productivity and better returns per dollar than late adopters. The gap is real. So is the upside. CFIB digital adoption media brief. BDC’s State of Entrepreneurship notes similar pressures—rising input costs and tougher competition—which makes faster, evidence‑based decisions the safer path. BDC State of Entrepreneurship 2025.
Here’s a before/after that maps to daily life:
- Before: Your team pulls a weekly CSV, pastes numbers into a deck, and argues over which column is “net.” Promotions are set by gut and copied from last year.
- After: Yesterday’s sales, returns, and inventory positions are live in a dashboard by 8 a.m. A single “lunch special lift” metric decides Tuesday’s offer. Staff schedules align with expected footfall, not hope.
The good news? You don’t need to boil the ocean. Start with one revenue‑critical decision you make every week. Instrument it. Then improve it.
🔑 Key Takeaway
Business intelligence is now accessible to SMBs, enabling data‑driven decision making without enterprise budgets or teams.
If you’re ready to explore, where should you look?
Exploring BI Tools and Competitive Analysis Resources
You’ll find two clusters of resources helpful as you get started: tools that make BI workable on day one, and references that feed the competitive picture you care about.
For tools, browse trusted directories that let you filter for small‑business use, budget, and integrations you already run. Start with the Canadian view on Capterra’s Business Intelligence software directory. If you want a sense of market coverage and categories, Gartner maintains public overviews of its Magic Quadrant research for analytics and BI platforms, useful for understanding vendor types and evaluation criteria even if the full report is gated. See the Gartner Magic Quadrant hub. Shortlist options like Microsoft Power BI and Tableau that connect cleanly to your existing systems.
For competitive analysis and implementation help, lean on Canadian sources you can cite in board or lender conversations. BDC’s practical guide on market research outlines step‑by‑step methods you can adapt without hiring a consultant. It’s a straight read for BI beginners who want a plan. BDC’s market research guide. For regional sizing, Statistics Canada’s interactive dashboards like Canadian Business Counts help you benchmark how dense your local category is before you pick a location or promo strategy. Statistics Canada’s Business Counts dashboard.
One more move that pays off quickly: write down your “decision moments” that happen on a fixed cadence (daily pricing checks, weekly reorders, monthly staffing plans). For each, specify the one KPI you’ll watch, the threshold that triggers action, and the data source. That simple practice creates BI discipline without extra software.
Question: where do proprietary insights fit? When we run Canadian SMB intelligence reports, a consistent theme emerges: the battleground keeps shifting under your feet. In Calgary metal fabrication, quality ratings converged at the top, so visibility and technology proof points became decisive. In Saskatoon casual dining, value, food safety assurance, and atmosphere now peak at once, so operators who test bundles and publish safety cues get both margin protection and trust. In Vancouver athletic wear, a chorus of global and influencer brands eats at share simultaneously, so local retailers who publish price‑value comparisons and spotlight in‑store exclusives hold attention longer. Competitive analysis isn’t abstract; it’s the live context your BI should absorb.
And if you want one thing to do today: list your top five repeat decisions for the next month and write, in one sentence each, the data you’ll use, the threshold that triggers a change, and the owner. Then pick a tool to visualize just those five metrics.
Common Questions About Business Intelligence
What types of data can businesses use for BI?
Start with operational records you already own: sales by SKU and channel, returns, inventory levels, discounts, and staff schedules. Add customer signals like reviews, NPS comments, and support emails. Round it out with market context such as competitor price checks, social mentions, foot‑traffic estimates, and public datasets. As a reality check, Statistics Canada reports rapid growth in the use of text analytics on reviews and emails among adopters, which fits SMB needs well because it’s inexpensive and close to the customer’s voice. That kind of “unstructured” data often explains why the numbers moved. Statistics Canada AI analysis, Q2 2025.
How can SMBs start implementing business intelligence?
Begin with one decision you make every week that affects revenue or margin. Define the metric that governs it, then gather only the data needed to compute and visualize that number. Choose an accessible BI tool that connects to your POS or ecommerce data without custom code, and appoint one owner to update, read, and act on the dashboard. Some platforms like Tableau focus on visual clarity, which shortens the path from “I see it” to “Let’s change it.” Pair the first dashboard with a written test plan so you learn from each change rather than just making changes. If you want structured help on market context, BDC’s practical market research guide walks through methods SMBs can use without heavy budgets. BDC market research guide.
Is business intelligence expensive for small businesses?
Not if you scope it tightly. Many BI tools now offer starter tiers priced per user per month, and directories let you filter for free and low‑cost options. The bigger “cost” is undisciplined scope: too many dashboards, no clear decisions. Canadian SMB research shows digital tools pay back quickly when they’re integrated into operations, with many firms seeing ROI inside two years and meaningful productivity gains earlier than that. Treat BI like you treat paid search: set a budget, define success, and measure returns. CFIB digital adoption media brief.
What are the key benefits of using business intelligence?
Four show up fast. First, better timing: you see demand shifts sooner and adjust pricing or staffing before the weekend crush. Second, fewer surprises: anomalies stand out when yesterday’s numbers are visible by morning. Third, clearer accountability: when each metric has an owner and a threshold, meetings move from opinions to decisions. Fourth, competitive clarity: by adding public signals (reviews, social mentions, store openings) to your dashboards, you avoid guessing about rivals. The Bank of Canada won’t set your promo strategy, but national data and industry bodies will anchor your calls in facts you can defend to lenders and partners. As an example of national perspective on SMB pressures and responses, see BDC’s State of Entrepreneurship 2025.
Ready to turn insight into motion? If you want a fast on‑ramp to market context that plugs into your BI practice, Aurevon’s Ecosystem Dynamics Report distills local competitor moves, pricing pressure, and channel share into a single decision brief you can act on. See how it supports your next 90‑day plan at aurevon.ca.
Mitchell Ozmun
SMB Researcher, Business Analyst - Saskatchewan Born and Raised