5 Steps to Accurately Size Your Market in 2026: how to size your market
A product launches. Crickets. Ads burn cash. The runway shrinks. The most common culprit is not a bad idea, it is a bad read on demand. CB Insights’ ongoing post‑mortems put “no market need” at or near the top reason companies fold, cited in roughly four out of ten failures. If you care about staying in business, you care about demand math. Market sizing is that math, and learning how to size your market separates confident plans from expensive guesses. CB Insights: top reasons startups fail.
The twist for small businesses and early‑stage founders is practical execution. You already know TAM, SAM and SOM in theory. What you need is a clear, field‑ready way to apply them, with Canadian data you can actually access this week. This guide shows exactly that path, using both top‑down and bottom‑up methods, local sources, and a simple spreadsheet model you can copy. If you have been unsure how to size your market, you will leave with a repeatable process that turns a fuzzy market opportunity into numbers you can run.
Related: How to calculate Total Addressable Market (TAM) - Startups 101 — Slidebean
1) Understanding TAM, SAM, SOM
Think of your market as three concentric circles you shrink from the outside in. Total Addressable Market (TAM) is everyone who could buy a product like yours. Serviceable Addressable Market (SAM), often shortened to serviceable market, is the slice you could realistically serve given your geography, channels, and offering. Serviceable Obtainable Market (SOM) is what you can credibly capture in an initial period, often year one. The first tells you the size of the ocean, the second your fishable bay, the third what you can net this season.
For a pizza shop, TAM is all food spending in Canada. Canadians spent, on average, just over ten thousand dollars per household on food in 2023, and that macro pool sets the ceiling. SAM is pizza spending in your city, filtered to households within your delivery radius and dining preference. SOM is the share you can actually win in your first year given hours, ovens, seats, delivery partners, and brand awareness. The shift from TAM to SAM to SOM is not a vocabulary exercise. It is a focus exercise. Statistics Canada, Survey of Household Spending 2023.
Why does this hierarchy matter for small firms? Because survival is statistical, and the early years are unforgiving. In Canada, only about 62% of micro‑employers with 1–4 staff are still active after five years, and the share shrinks further by year ten. Right‑sizing expectations is a defensive play as much as an offensive one. If SOM math says your first‑year cap is 2% of local pizza orders, plan operations and cash around 2%, not 10%. That restraint keeps you alive to earn growth. ISED, Key Small Business Statistics 2024.
One more way to anchor the idea. TAM is a country‑wide aerial photo. SAM is a city map. SOM is tonight’s delivery route. When you confuse the photo for the route, you miss dinner. In one line, TAM SAM SOM explained means total demand, reachable demand, and the slice you can actually win first.
With the concepts straight, the question becomes method: how do you turn circles into numbers you trust?
2) Top‑down Market Sizing Method
Top‑down market estimation starts with authoritative industry totals, then narrows step by step to your reachable segment. It is fast, credible when sourced well, and useful when you have limited primary data. The trade‑off is precision. You will be allocating portions of large numbers with assumptions that need cross‑checks.
Here is a practical top‑down flow for Canadian founders:
1) Identify the correct NAICS code. Find the six‑digit North American Industry Classification System code that best matches your business. Start at Statistics Canada’s NAICS 2022 introduction page, then confirm with a provincial library guide if needed. Accurate coding unlocks consistent revenue, firm counts, and growth rates across sources. Statistics Canada: NAICS Canada 2022.
2) Pull national or provincial totals. Use Statistics Canada tables, reputable industry publishers, or government summaries to capture revenue and unit counts. For paid industry overviews, IBISWorld and Statista can help you benchmark category size and growth. If you are validating a restaurant concept, combine household food spending and foodservice revenue trends to bound the category. For professional services or retail, look for NAICS‑level revenue per establishment to triangulate averages. When in doubt, the Government of Canada’s market research portal links to current datasets and explains access paths. Canada.ca: Guide to market research and analysis.
3) Filter to your geography. Apply the share of population or households in your target city or CMA using the Census Profile, or use provincial totals when city‑level industry revenue is unavailable. This step translates national figures into your local market opportunity.
4) Narrow by channel and price tier. If your retail concept is premium and primarily online, apply the share of category spending that flows through e‑commerce at your price point. If you operate a service with in‑person delivery, reduce the pool to the zip codes you can reach within a profitable radius.
5) Sanity‑check with competitive density. Count local competitors by category and rough capacity. If your allocation implies more weekly orders than ovens exist to fulfill, you have over‑allocated.
What does this look like with real signals? In our analysis of a Calgary custom metal fabricator via the Aurevon Intelligence Service (March 2026), the local market’s review scores clustered near perfect. The battleground had shifted away from “prove quality” toward visibility, local supply chain proof, and technology adoption, which materially changes how you allocate attainable share in a saturated SAM. In other words, even a healthy TAM requires top‑down adjustments when the local competitive posture compresses differentiation.
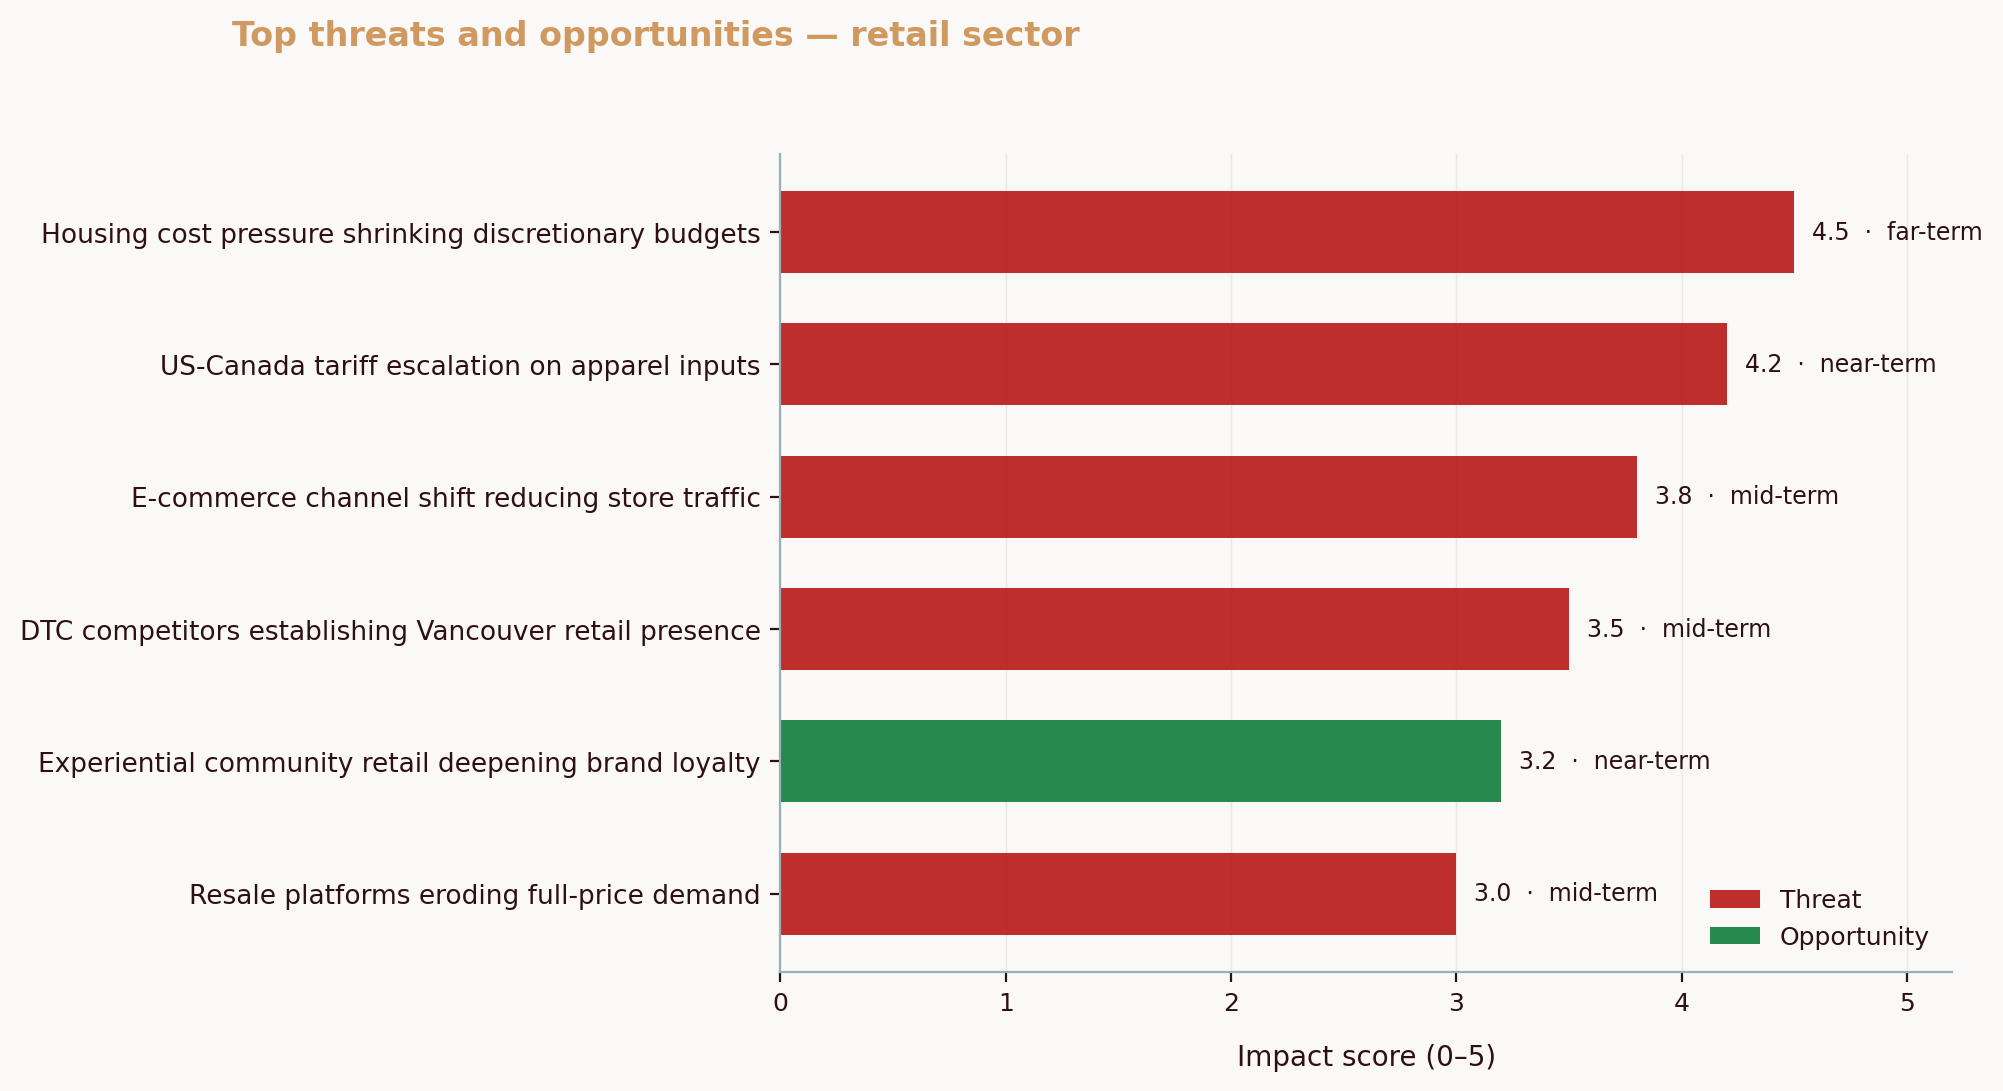
Or take a Vancouver athletic‑wear retailer we studied the same month. One business dominated local social chatter with roughly 40% of mentions, but global entrants on Robson and Metrotown plus influencer‑driven brands were eroding that dominance from multiple directions. A top‑down cut that ignores channel shifts and brand gravity will overshoot SOM for a new entrant in that neighborhood.
Strengths of top‑down: speed, cite‑ability, and comparability across markets. Limitations: it can hide local anomalies, and small misallocations compound quickly. The remedy is triangulation. Treat top‑down as your aerial view, then pull street‑level truth from the bottom‑up method next.
💡 Pro Tip
Always cross‑verify national or provincial totals with two local signals: a quick competitor capacity scan and one neighborhood‑level demand proxy (for example, foot‑traffic reports or delivery app order density). The combination catches mismatches early.
3) Bottom‑up Market Sizing Method
Bottom‑up market sizing starts with people or accounts you can name, count, and price. It is slower upfront, but it produces numbers you can defend in a pitch or a bank meeting. The logic is simple: count targets, estimate realistic conversion, multiply by average spend, and pressure‑test with capacity.
A field‑ready sequence looks like this:
1) Define your ideal customer profile precisely. For B2C, write it as households within X kilometers, with Y traits that predict purchase. For B2B, list firm size, industry code, and any gating technology or compliance requirements.
2) Count the targets. Use the 2021 Census Profile for households by neighborhood to tally B2C prospects. For B2B, combine NAICS‑filtered business directories, municipal business licensing lists, and provincial registries to build a list. Library guides from Canadian universities often show how to pull NAICS‑based lists efficiently if you do not have paid tools. Royal Roads University NAICS research guide.
3) Estimate conversion and cadence. If you are a bar or family pizza restaurant in Saskatoon, our March 2026 nightlife report saw a simultaneous push for better value, stronger food safety signals, and more compelling atmospheres. That triple pressure squeezes margins and slows trial. Use that context to nudge your first‑year conversion rate down, or your average ticket up only if your concept credibly answers the pressure points.
4) Set average spend from credible anchors. For households, anchor to Statistics Canada’s Survey of Household Spending at the category level, then adjust to your concept and neighborhood income profile. For B2B, benchmark annual contract values or category budgets from industry bodies or provincial procurement data.
5) Multiply and adjust for capacity. Weekly seats, delivery slots, install crews, and service hours cap SOM. If your math implies 140 weekly tables but you can seat 100, SOM is 100 until you add capacity.
Before and after, so you can feel the difference:
Before: “We think 10% of local diners will try us in year one.”
After: “There are 14,800 relevant households within a 3‑km radius. A conservative 3% will order at least once a month in year one given current price sensitivity and a competitors’ map of 11 outlets. At an average of $38 per order and 1.4 orders per month, that is $28,400 monthly demand, capped by 1,200 pizzas per week at current oven capacity.”
Bottom‑up’s advantages are defensibility and local fit. The downside is effort, and the risk of small sample bias if you rely on too few observations. You reduce that risk by layering multiple counts and by reconciling your totals with the top‑down view. This is market sizing for small business that stands up to scrutiny.
4) Free Data Sources for Market Sizing
You do not need a research budget to get credible inputs in Canada. Start with these sources, then add municipal open data, public library databases, and provincial dashboards as needed.
- Statistics Canada Census Profile: population, households, income, age, and dwelling data down to neighborhood levels. Pull counts to size B2C targets by radius or postal code. Census Profile portal.
- Statistics Canada Survey of Household Spending: category spending anchors to set TAM and stress‑test average spend. Household spending 2023.
- NAICS Canada: pick the right industry code to unlock consistent industry data and firm counts. NAICS 2022 overview.
- BDC research and how‑tos: practical guides and reports that point to current indicators and tools for small firms. BDC’s market research guide.
- Chambers of Commerce and Boards of Trade: member directories, local reports, and contacts who know on‑the‑ground demand and competitive dynamics. The national chamber summarizes the network and often links to local directories. Canadian Chamber of Commerce overview.
Here is a quick comparison you can bookmark.
| Source | Type of Data | Access Method | Notes |
|---|---|---|---|
| Statistics Canada Census Profile | Population, households, income, age by geography | Free web tables and CSV downloads | Ideal for defining B2C target counts at ward or neighborhood level. |
| Survey of Household Spending (StatCan) | Category spending per household | Free summary tables and PDFs | Use as an upper bound for local TAM; adjust for your city’s income distribution. |
| NAICS Canada (StatCan) | Industry definitions and codes | Free web reference | Selecting the right 6‑digit code makes cross‑source comparisons cleaner. |
| BDC research library | How‑tos, trend reports, SME data | Free articles and PDFs | Helpful for context and tactics when you lack paid tools. |
| Local Chamber of Commerce | Business directories, local reports | Free directories, some member‑only content | Great for competitor counts and intros to buyers or landlords. |
| Canada.ca Market Research Guide | Aggregated links to federal data | Free portal | Shortcut to official datasets and services for SMEs. |
A short, practical tip: lock in one canonical NAICS code for your concept and add it to every search. It is like switching on a blacklight for relevant data. If you later add paid tools, industry publishers such as IBISWorld or Statista can accelerate category scans and trend checks.
For a structured checklist, you can also skim our business validation cluster and market research pillar for stepwise workflows and templates.
5) Market Sizing Spreadsheet Formula
You do not need fancy software. A simple sheet will do the job as long as you keep inputs transparent. Build three blocks and make your assumptions visible in cells, not your head.
- Top‑down TAM: Category revenue or spend total.
- Top‑down SAM: TAM × geography share × channel or segment share.
- Top‑down SOM: SAM × realistic penetration rate (year one).
- Bottom‑up SAM: Target count × expected buyers per period × purchases per buyer × average spend.
- Bottom‑up SOM: Bottom‑up SAM capped by your operational capacity.
A worked example for a city‑neighborhood pizza startup using blended top‑down and bottom‑up:
Assumptions
A1: Households within 3 km = 14,800 (Census Profile query).
A2: Average monthly food‑away‑from‑home spend per household = $250 (anchor to StatCan category level, then haircut for your area).
A3: Share of that spend on pizza and similar quick‑serve = 12% (local interviews and delivery‑app menu distribution).
A4: Your realistic first‑year capture of local pizza orders = 3% (given 11 active outlets and a soft opening plan).
A5: Average order value = $38; average orders per ordering household per month = 1.4.
A6: Oven capacity = 1,200 pizzas/week.
Top‑down pass
TAM (localized) = A1 × A2 = 14,800 × $250 = $3,700,000 per month across all eating‑out.
SAM = TAM × A3 = $3,700,000 × 12% = $444,000 per month for pizza‑type orders in area.
SOM (year one) = SAM × A4 = $444,000 × 3% = $13,320 per month.
Bottom‑up pass
Ordering households = A1 × first‑year trial rate of 3% = 14,800 × 0.03 = 444 households.
Monthly revenue estimate = 444 × 1.4 × $38 = $23,606 per month.
Capacity check
Weekly demand implied by bottom‑up = $23,606 ÷ $38 ÷ 4.33 ≈ 142 orders per week.
Capacity = 1,200 pizzas per week. No capacity cap binding, so use $23,606 as SOM. If the sheet flips and demand exceeds capacity, cap SOM at capacity until you add ovens or staff.
Which number should you believe? Use the more conservative estimate as your plan and the higher as your upside case. And update the inputs monthly as you collect real order data. That is how the sheet graduates from a planning tool to an operating dashboard. If you prefer a formula name, think of this as practical market size estimation you can calculate in minutes and refine over time.
To help you kick this off quickly, set up five named ranges in your sheet—TargetHouseholds, SpendPerHH, PizzaShare, Trial_Rate, AOV—and store the rest as formulas. A single cell change then updates every dependent metric. Not a guess. A plan.
Common Questions About Market Sizing
What is the difference between TAM, SAM, and SOM?
TAM is the total demand for a category under ideal conditions, the outside circle. SAM is the portion you can reach based on where you operate and how you sell, the practical middle circle. SOM is what you can credibly win in an initial period given competition, capacity, and awareness, the innermost circle. For small firms, SOM is the number that drives staffing, inventory, and cash planning. TAM SAM SOM explained in everyday terms means total, reachable, and winnable.
How do I choose between top‑down and bottom‑up methods?
Match method to what you know. If you have reliable industry totals and want a fast first cut, start top‑down, then adjust. If you know your local buyer list and capacity constraints well, start bottom‑up to produce numbers you can defend. In practice, do both and reconcile the results. Think of it as checking a map against the odometer. For a startup, calculate market size by pairing a top‑down anchor from Statistics Canada or BDC with a bottom‑up list of nearby buyers, then take the lower of the two for planning. BDC’s market research guide and Statistics Canada spending tables are reliable starting anchors.
What if I can’t find local data sources?
Start with national or provincial data, then scale by local population and income distribution. Use the Census Profile for your city to calibrate household counts and median incomes. Then add at least one on‑the‑ground proxy such as competitor capacity, mall foot‑traffic, or delivery‑app density to localize your assumptions. The federal market research portal also aggregates many SME‑relevant datasets in one place. Canada.ca market research guide.
How accurate can my market sizing be?
Accuracy tracks the clarity of your assumptions and the quality of your inputs. You will not get perfection on day one, but you can get to “accurate enough to decide.” Use authoritative sources for anchors, like Statistics Canada and ISED reports, then cross‑check with local signals. Update your sheet monthly with real sales and conversion data so your SOM converges on reality. Over time, variance narrows and confidence rises. ISED survival rates and Statistics Canada spending tables help set guardrails; your data turns them into decisions.
What is a good market size for a small business? Aim for a SAM that can support breakeven at your realistic SOM within 12 to 18 months, with room to double without changing your model. A practical heuristic is a SAM at least 20 to 30 times your first‑year revenue target, so that a 3% to 5% SOM can sustain early operations.
How do I estimate my market share? Divide your expected year‑one revenue by the localized SAM, or divide your expected unit sales by the total units sold in your segment and area. Track it quarterly so the ratio reflects reality, not wishful thinking.
Take one action today: open the 2021 Census Profile for your city, draw a 3‑km radius around your location, and write down the count of relevant households or firms. That single number lets you build a first SAM in under an hour. Then sanity‑check it against a top‑down anchor and your capacity.
If you want step‑by‑step checklists and worksheets, browse our business validation cluster and our market research pillar for templates you can copy and adapt to your industry.
At the very end—if you need a curated view of local demand signals without hiring consultants—Aurevon’s Ecosystem Dynamics Report distills competitor capacity, buyer chatter, and channel shifts into a single market sizing brief you can act on. Learn more at our report page: Ecosystem Dynamics Report.
Sources cited above:
- “Top reasons startups fail,” CB Insights post‑mortems and analysis. CB Insights.
- “Key Small Business Statistics 2024,” Innovation, Science and Economic Development Canada, including survival rates by firm size. ISED.
- “How Canadian households spent their money in 2023,” category spending anchors. Statistics Canada.
- NAICS Canada 2022 overview for consistent industry coding. Statistics Canada NAICS.
Mitchell Ozmun
SMB Researcher, Business Analyst - Saskatchewan Born and Raised