How to Leverage Affordable Business Intelligence for Small Business Growth
Card declines at the register. A supplier misses a shipment. Your best sales rep asks for data you don’t have. Decisions stall. Revenue slips. The good news is you don’t need an enterprise-sized budget to stop that slide. With affordable business intelligence, small business owners can stand up a lean, credible insight engine in days, not months. This approach gives you affordable market intelligence that is practical and fast to act on.
If you’re in Canada, this gets even better: free public datasets, freemium analytics tools, and low-cost snapshots can cover 80% of the questions most SMBs ask. Think search trends, competitor web traffic estimates, provincial registry checks, and one or two paid seats for dashboards. In practice, many teams cobble together a dependable stack for well under $200 per month, then scale only when the payoff is obvious. That is cost-effective market research powered by low-cost business data and SMB analytics tools, not large software contracts.
Related: We Tested 4 Small Business ERPs—Here’s What Actually Works — Software Connect
Understanding BI and Its Importance for SMBs
Business intelligence is the habit of turning raw signals into decision-ready insight. It isn’t a software logo. It’s the loop where you collect, clean, compare, and act on data from sales, marketing, operations, and the market outside your walls. Think of it as adding a dashboard to your business the way you rely on a dashboard in your delivery van. Speed, fuel, warning lights. You glance, you adjust, you avoid costly mistakes.
Why does this matter now? Canadian small firms that adopt digital tools report quicker wins and measurable returns. In a 2025 survey of 1,683 owners, the Canadian Federation of Independent Business (CFIB) found technology investments delivered a 29% average productivity lift and about $1.60 in return for every $1 invested, with leaders capturing even more. That is budget pressure turned into growth. CFIB digital transformation report.
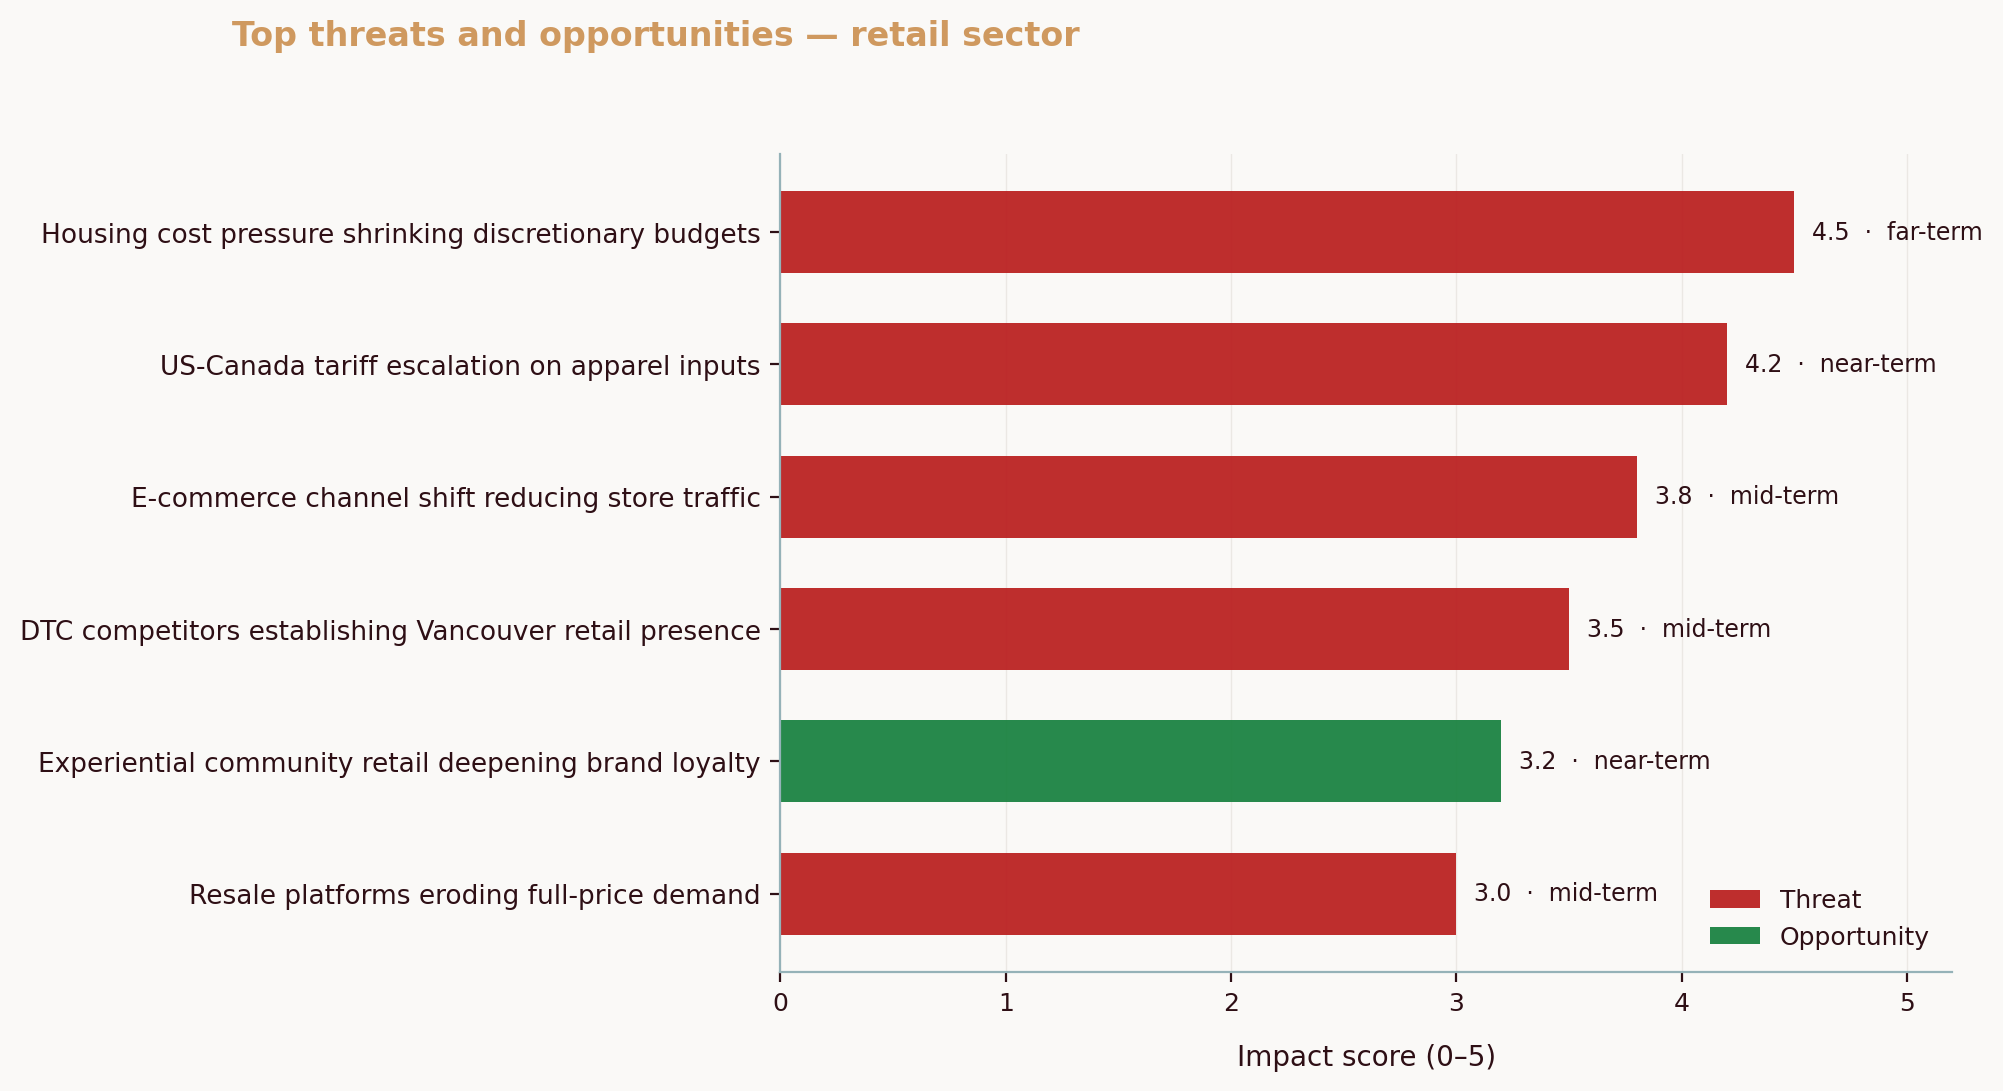
Here’s how this actually plays out for local competitors. In our analysis of a Calgary custom metal fabrication manufacturer and a Saskatoon bar via the Aurevon Intelligence Service (March 2026), the risk wasn’t “quality” alone. The metal shop faced a market where review scores are already sky‑high, so visibility, supply chain proximity, and proof of modern tech like CNC and welding robotics decided the win. The Saskatoon venue felt a triple squeeze from value seekers, stricter food safety expectations, and demands for better atmosphere, all while margins thinned. In both scenarios, the data shifted the question from “Are we good enough?” to “Where do we win first: discovery, trust, or cost position?”
If you pull one thread from BI, let it be this: small choices compound. Spotting a demand uptick two weeks earlier than a competitor, shelving a slow mover before it ties up cash, catching a service lapse before it becomes a Google review. Each move is small. Together they change your year.
So what does this mean for you? Start where the friction is loudest. If late deliveries are killing repeat business, build a one‑page on‑time and backlog tracker. If margins wobble, pull a price-volume waterfall. If traffic is flat, monitor category search trends. Then set a weekly 20‑minute review. Short. Focused. Useful.
Breaking Down BI Costs into Tiers
How much does business intelligence cost? For most Canadian SMBs, practical setups range from free to a few hundred dollars per month for core reporting, with larger builds crossing $1,000 when needs get complex. When you scope affordable business intelligence, small business teams usually live in the two lowest tiers until results justify more.
- Free: Public data, freemium dashboards, and simple alerts. Best for early discovery and quick sanity checks.
- Budget ($0–$100/month): One paid dashboard seat, light automation, and a couple of data connectors. Ideal for weekly KPI reviews.
- Mid-range ($100–$500/month): Multiple users, better governance, scheduled refreshes, richer connectors. Fit for multi-location teams or those with layered data.
- Enterprise ($1,000+/month): Advanced modeling, embedded analytics, and high-touch support. Usually overkill for SMBs unless data is the product.
That explains the tiers. Here’s how tools commonly fit.
| BI Tool | Cost | Key Features | Target User |
|---|---|---|---|
| Google Trends | Free | Search interest over time, geographic splits | Owners validating demand shifts |
| Statistics Canada data tables | Free | Official economic, sector, regional datasets | Operators planning inventory and staffing |
| Looker Studio (free) | Free | Basic dashboards, connectors to sheets and ad platforms | Teams starting dashboards |
| Google Alerts | Free | Mentions of brands, products, topics | Owners monitoring competitors |
| SimilarWeb (free tier) | Free | High-level site traffic and sources | Marketers benchmarking rivals |
| Microsoft Power BI Pro | Typically under $20/user/month | Interactive dashboards, scheduled refresh, sharing | Managers needing governed reporting |
| Zapier/Make (starter plans) | ~ $20/month | Simple automations, scheduled pulls | Non-technical teams wiring tools |
| Databox/Geckoboard | ~ $50–$200/month | Prebuilt KPI boards, mobile views | Leaders wanting at-a-glance metrics |
Budgets are only half the story. Data availability is the other half, and Canada’s public sources make the “free” tier unusually strong. With the cost frame in mind, let’s look at the best no‑cost places to fuel your analysis.
Highlighting Free Canadian Data Sources
Canadian SMBs enjoy a deep bench of authoritative, no‑cost data. Use it. It trims spend and grounds your choices in credible signals that bankers, buyers, and boards trust.
- Statistics Canada: Start with The Daily and interactive dashboards for sector, region, and business-conditions reads. For example, the Business Conditions in Rural and Small Town Canada dashboard offers quarterly updates you can compare with your own sales pulse. Bookmark and build a simple cadence to check new releases. Statistics Canada dashboard overview.
- BDC Research: The Canadian Small Business Health Index blends survey, credit, and macro data, and its commentary helps you separate a short-term dip from a structural change. That context is gold when planning inventory or negotiating with lenders. BDC Small Business Health Index.
- Innovation Canada: Use the Business Benefits Finder to search grants, advisory programs, and credits by location, size, and need. Filter by “digital adoption” or “market expansion” to find supports that pair well with your BI roadmap. Business Benefits Finder guide.
- Provincial business registries: Track new incorporations in your category to see where competition is forming. You won’t get a full strategy from a listing, but a spike in new salons, fitness studios, or contractors in your postal codes is a signal to update pricing, promos, or hours.
Practical moment: imagine a Halifax bookkeeping firm checking StatsCan for local professional services growth, using Google Trends to confirm seasonal search peaks for “bookkeeping help,” then noting a rise in new incorporations in the provincial registry. That mini‑triangulation justifies hiring a part‑time associate ahead of tax season and launching a seasonal bundle two weeks earlier. Small, timely, and specific. This is budget competitive analysis that proves small businesses can afford competitive intelligence without heavy software.
One more reason to lean on official sources: stakeholders trust them. Cited data wins arguments and aligns teams, and it can also help justify a loan, since lenders and advisors speak the same language when you reference national tables and recognized indices.
Comparing Costs: Consultants vs Automated Reports vs DIY
Money and time both matter. Consultants can be worth it, but not every question needs a bespoke engagement. Automated reports are faster and cheaper for snapshots. DIY stretches dollars, but it burns hours. Use this to decide where you fit.
| Option | Cost Range | Time Investment | Best For |
|---|---|---|---|
| Consultant engagement | Commonly $5,000–$15,000 per defined-scope project in Canada, sometimes higher | 10–25 internal hours for scoping, reviews, and data access over 2–6 weeks | Complex questions, first-time builds, or when impartiality is essential |
| Automated market or KPI report | Roughly $50–$500 per report, depending on depth and source | 1–3 hours to customize, interpret, and plan actions | Quick competitive snapshots, board updates, pilot KPIs |
| DIY with free/low-cost tools | $0–$100/month for tools, no vendor fees | 10–20 internal hours to gather, clean, and visualize | Scrappy teams comfortable with spreadsheets and iteration |
Two points to anchor these ranges. First, a Canada-based operations consultancy pegs typical defined-scope projects at $5,000–$15,000, which aligns with what many SMBs encounter when scoping analytics and workflow audits. If you buy once, buy right. Lodestone article on consulting costs in Canada. Second, report-based pricing models from aggregator reviews often start near $50 per report, escalating with depth and volume. That makes “buy a snapshot, validate a hunch” an attractive first step before committing to a full platform. FitGap pricing overview.
Before versus after is the real test:
- Before: Quarterly decisions made by gut feel, late-night spreadsheet wrestling, and ad hoc screen grabs.
- After: A weekly 15‑minute dashboard stand‑up, a monthly category trend pulse, and a “traffic and conversion” competitor check that takes five minutes. You free up headspace for actual selling.
If you’re weighing options, ask: Is this a recurring decision or a one-off? Recurring decisions justify small, ongoing spend. One-offs justify a quick report or a short consultant sprint. If you are wondering what the cheapest BI tool is, start with the free options in the table like Looker Studio and Google Trends, then consider Microsoft Power BI Pro when you need sharing and governance at a low price point.
Starter BI Stack Recommendation
Here’s a practical stack a typical Canadian SMB can run for under $100 per month. It assumes one “owner-analyst,” a manager who reviews KPIs weekly, and a small team that needs simple views on web and phone. These are SMB analytics tools designed to reduce manual work and keep focus on decisions. This setup delivers affordable business intelligence small business operators can maintain without a dedicated analyst.
1) Source layer: trustworthy data you can defend
- Statistics Canada for sector, region, wages, and business conditions. Save relevant tables and note release calendars for your industry. [StatsCan dashboard link above].
- Google Trends for demand signals around your product names, seasonal spikes, and province-level shifts.
- Provincial business registries for new entrants you should watch.
- BDC’s Health Index to sanity-check your read of the cycle. [BDC link above].
2) Collection and light automation: make refresh painless
- Google Sheets as the “data staging” area. One sheet per source, one “model” tab for cleaned fields.
- Zapier or Make on a starter plan to schedule pulls from forms, CRM, or ads platforms into Sheets.
- Google Alerts for your brand, top competitors, and category terms. Set to “At most once a day.”
3) Visualization and sharing: decision-ready, not decorative
- Looker Studio (free) for your first dashboard. Start with three tiles: revenue or bookings, pipeline or reservations, and a market pulse (Google Trends for your main term plus a StatsCan indicator for your sector).
- If your team needs formal governance or row-level security, add a single paid seat in Power BI Pro for the owner-analyst and publish a web-secured app for read-only users.
4) Monitoring and market pulse: what changed this week
- SimilarWeb’s free tier to eyeball monthly traffic trends for two to three close competitors.
- A simple “competitor card” doc: homepage messaging, price or promo notes, top content piece, any hiring clues.
5) Cadence and decisions: the habit that compounds
- Weekly: 15‑minute stand‑up to review wins, misses, and one “why” deep dive.
- Monthly: market pulse check, update targets, and one small bet (new channel test, bundle tweak, in‑store signage change).
- Quarterly: reset the dashboard to kill vanity metrics and elevate one new leading indicator.
So what does this actually look like on Day 1?
- Today: pick one revenue metric, one funnel metric, and one market signal. Build a one‑page Looker Studio view fed by Sheets. Set one Google Alert for your brand and one for your top competitor. Put a 20‑minute recurring “KPI Friday” on your calendar.
- Next 7 days: wire a single Zapier automation that copies yesterday’s CRM or POS data into Sheets at 6 a.m. Add a second dashboard tile for customer acquisition cost or table turn time.
- Next 30 days: compare your month-over-month variance with a StatsCan indicator that tracks your sector’s sales or employment. If they diverge, ask why.
💡 Pro Tip
Start small with BI tools and scale as your business grows. Prove value on one decision loop, then add a connector or paid seat only when the next decision demands it.
Two final confidence boosts. First, CFIB reports that 92% of Canadian small businesses already use digital tools, but only 10% have integrated them end to end. That gap is your opportunity to pull ahead with simple habits, not a massive overhaul. CFIB media release on digital adoption. Second, Innovation Canada’s programs and advisors can offset parts of your digital and analytics investment, especially if you tie them to productivity or market expansion. ISED overview of supports.
For deeper how‑tos on scoping rivals and turning metrics into actions, see the competitive analysis pillar and the data-driven decisions pillar.
Common Questions About Affordable Business Intelligence
What are the best free BI tools for Canadian SMBs?
For quick insight without spend, combine Google Trends, Google Alerts, and Looker Studio with official data from Statistics Canada. Add the BDC Small Business Health Index to judge whether a dip is you or the market. This trio covers demand, competitors, and macro context, which is enough to guide weekly choices until you need paid connectors or governance. Yes, small businesses can afford competitive intelligence using low-cost options like SimilarWeb’s free tier, Google Alerts, and provincial registries, which together enable budget competitive analysis. If you want the cheapest path, start with those free tools, then add Power BI Pro only when you need secure sharing. Statistics Canada dashboard. BDC index.
How can I justify the cost of a BI tool to my stakeholders?
Use the “one loop ROI” test. Pick a recurring decision, document the time you spend today, and price the improvement. CFIB’s research shows small firms often see fast payback on digital tools, with strong productivity gains and positive returns per dollar invested. If a $20/month license lets you avoid one stockout or trims 30 minutes of manual reporting each week, the math is simple and credible. CFIB digital transformation report.
Is it worth hiring a BI consultant for a small business?
Sometimes, yes. If the question is complex, politically sensitive, or tied to financing, an external analyst can de‑risk decisions and move faster. For many SMB needs, though, automated reports and a DIY stack answer 80% of questions at a fraction of the cost. In Canada, defined-scope consulting projects often start in the mid‑four to low‑five figures, so use them where the stakes justify it and keep a lightweight internal stack for everything else. Consulting cost reference.
How long does it take to implement a BI solution?
A simple, automated report can be live in a few days. A clean, recurring weekly dashboard with two or three sources usually takes a couple of weeks once access is sorted. Bigger builds that involve modeling, permissions, and multiple systems can run for several weeks. If you’re time‑constrained, start with a basic weekly KPI view and layer in sources as you prove value.
Ready to turn signals into decisions quickly? The Ecosystem Dynamics Report from Aurevon gives Canadian SMBs a concise, affordable read on competitors, demand shifts, and channel moves in their specific market. Grab a sample and see how a single, decision‑ready snapshot can jump‑start your BI habit: https://aurevon.ca/ecosystem-dynamics-report.
Mitchell Ozmun
SMB Researcher, Business Analyst - Saskatchewan Born and Raised