Where Canadian Restaurants Are Losing Margin in 2026: a playbook for restaurant margin defense Canada 2026
Guests ask about smaller portions. Your line cook texts in sick again. The utility bill hits a new high. Then your bookkeeper says the month was “barely breakeven.” That is the 2026 reality for too many Canadian operators.
The data backs it up: between 41% and 44% of restaurants were breaking even or losing money through mid-to-late 2025, and nearly half expected profitability to worsen into 2026. If you feel squeezed, you are not imagining it. The fix is not one silver bullet, it is a sequence of tactical moves: a surgical menu audit that trims 15–20% of low-value items, supplier decisions that reduce freight and tariff exposure, targeted front-of-house automation where it actually lowers labour variance, and a hard pivot to protect weekday lunch and happy hour. That is restaurant margin defense Canada 2026, executed, not theorized. [Restaurants Canada Q2 and Q4 reports show the 41–44% figure and operator expectations.] (foodserviceandhospitality.com)
With that on the table, here is the tactical playbook.
Related: 5 Must Know Reasons Why Coffee Shops FAIL In Their First Year | Start a Cafe Business 2022 — Wilson K Lee - How To Open A Restaurant / F&B Shop
Understanding the Cost Stack
Start with the four costs doing the most damage: food, labour, rent, and utilities. Statistics from Innovation, Science and Economic Development Canada’s Financial Performance Data for NAICS 722 paint the picture clearly: cost of sales averages 44.7% of revenue, labour and commissions about 23.3%, rent roughly 8.3%, and utilities near 2.5%. Those four lines alone can claim three-quarters of your sales. If one slips out of range, net operating margin evaporates. (ised-isde.canada.ca)
Sector-level math reinforces the urgency. Statistics Canada reported an average operating profit margin of 4.1% for food services and drinking places in 2024, up from 3.6% in 2023, but still fragile for independents facing higher input volatility than chains with scale. Even as the Consumer Price Index cooled overall, StatCan flagged that prices for food purchased from restaurants climbed sharply in late 2025, which limited headroom to raise menu prices further without hitting demand. The Bank of Canada’s CPI dashboards are a useful backdrop here when you are deciding whether to take price or chase cost. When price increases no longer rescue the P&L, the only path is smarter food cost control and labour discipline. (www150.statcan.gc.ca, bankofcanada.ca)
Why do larger systems weather this better? National chains buy at scale, distribute fixed tech and training costs across hundreds of stores, and negotiate leases from a position of strength. Chain-level data and industry reviews show wages rising since 2015 and commercial rents sitting above 2019 levels, yet multi-unit operators offset part of that through consistency and throughput. Independents, with thinner bench strength, feel every variance point immediately. The takeaway is not envy, it is strategy: run your shop as if it were a small chain by standardizing decisions where variance is most costly. (restaurantsummit.ca)
So the risk is real. What can you do this week to stop the bleed and protect restaurant profitability?
Menu Engineering Audit
The fastest path to improved contribution margin is often subtraction. A disciplined menu engineering audit will typically flag 15–20% of items that look fine on paper but destroy margin in practice. Three red flags earn an item a place on the chopping block:
- Food cost consistently above 35% at current vendor pricing and waste patterns.
- Prep labour exceeding 10 minutes per order or tying up a dedicated station during peak.
- Low order frequency that clogs mise en place or storage with slow-moving SKUs.
Here is how this actually works. Pull 90 days of POS data and rank items by contribution dollars, not popularity. Tag each item with food cost, average prep time, and weekly velocity. Overlay prep complexity: multi-SKU sauces, single-use garnishes, and hard-to-portion proteins rise to the top of the cut list. Then simulate two rounds of price and portion tweaks before eliminating anything, because a 3% price nudge plus a 5% portion right-sizing sometimes saves an underperformer without killing a fan favourite. Think of it like pruning a grapevine, removing the weak canes channels more sugar to the clusters that pay.
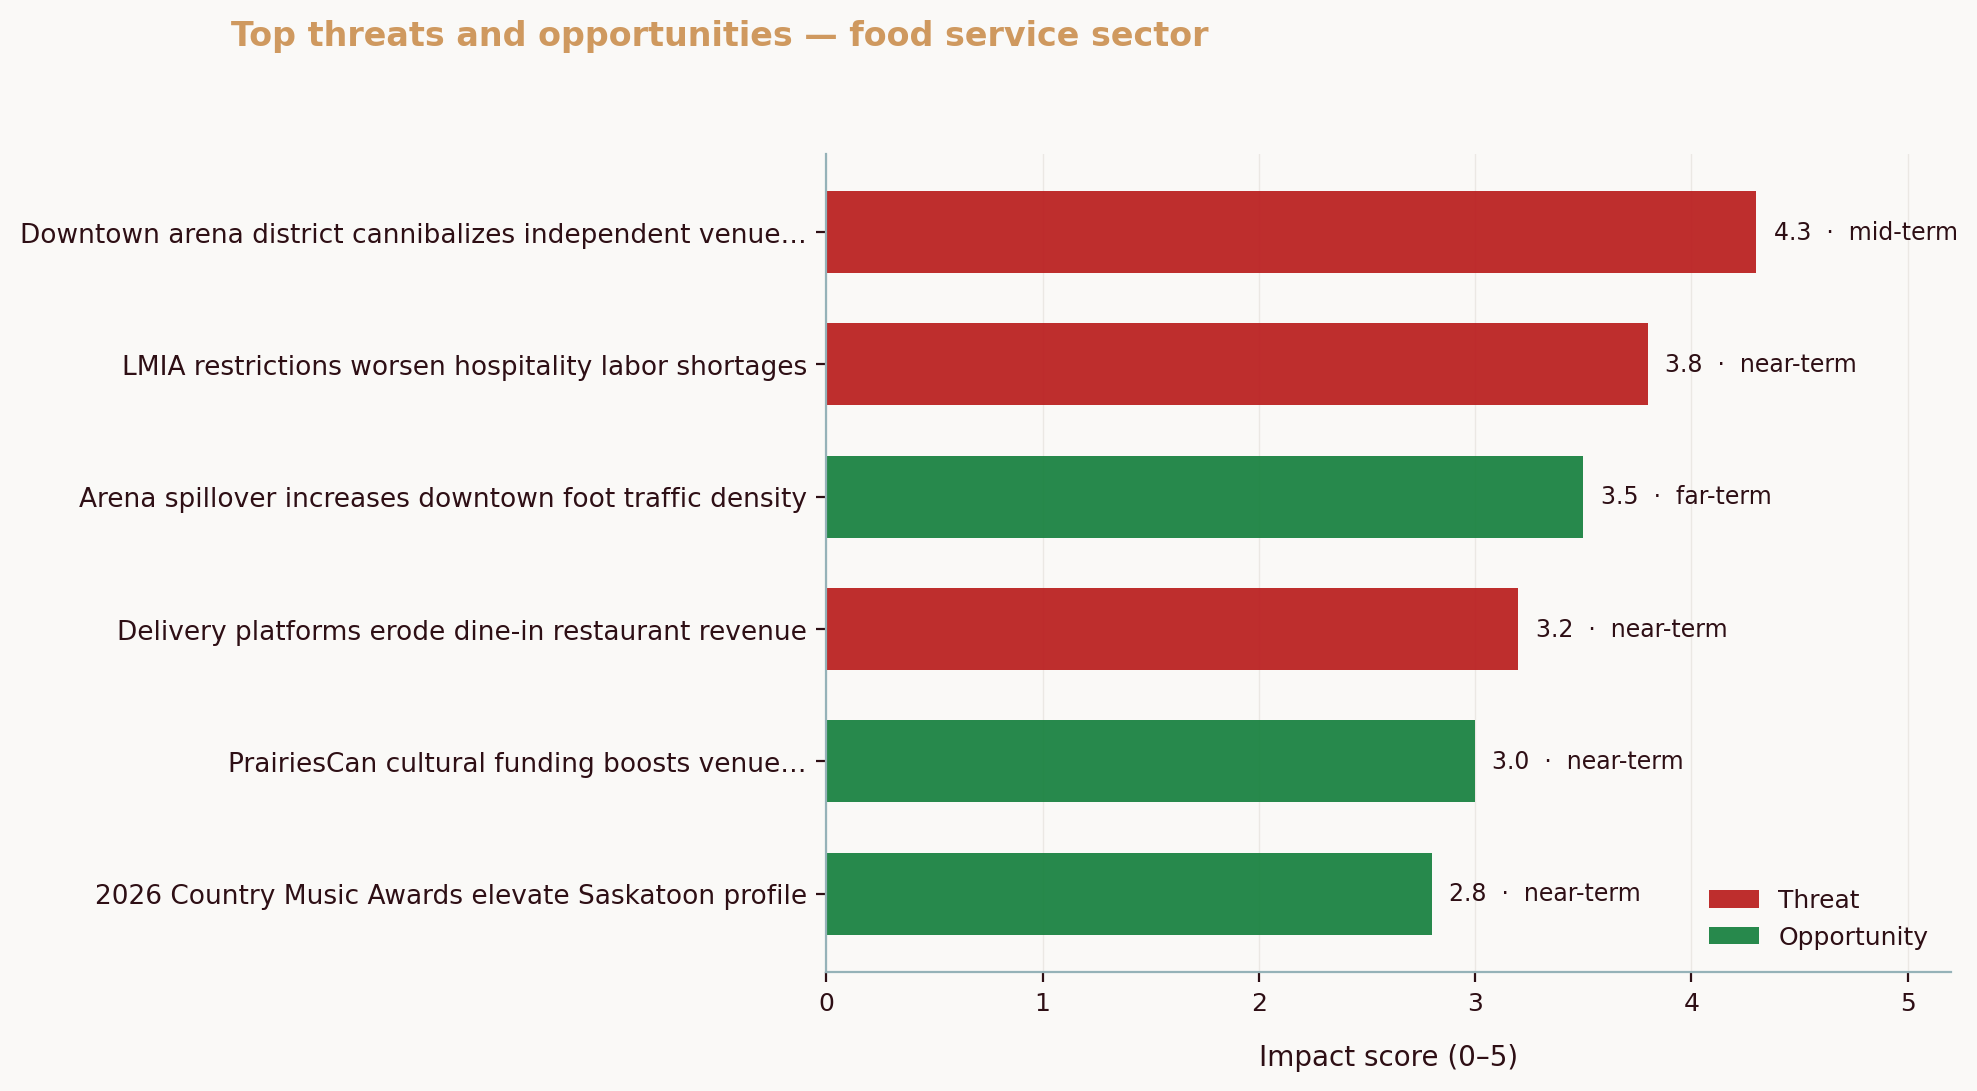
Across our April 2026 analysis of an anonymized Saskatoon restaurant, a 12-item reduction did exactly that. By dropping low-velocity, high-labour appetizers and reframing two mains as rotating weeknight plates, the restaurant lifted contribution margin eight points within six weeks while cutting prep hours on weekdays. The catalyst was clarity: they could not win on bloat when Regina mega-venues were reshaping entertainment spending, so they focused on profitable items and the dayparts they could own. Source: Aurevon Intelligence Service analysis, Canadian food service SMB, April 2026.
One more angle matters in 2026: perceived value. In March 2026, analysis of a Montreal French brasserie cohort showed a “dual-force” attention spike during Montréal en Lumière and concentrated editorial “best-of” coverage, but diners rewarded value clarity above everything else. Classic dishes with crisp pricing signals earned loyalty, while me-too menu sprawl diluted it. That is a reminder to sharpen category benchmarks on your menu, not drown them. Dalhousie’s Agri-Food Analytics Lab has been tracking how Canadians perceive food inflation and shrinkflation, context that should inform pricing signals on your board. Source: Aurevon Intelligence Service analysis, Canadian food service SMB, March 2026. (dal.ca)
Before you cut, give cards-on-the-table context to your team. Explain the cut criteria and where saved hours will go (speed, hospitality, or lunch execution). Then measure again in 30 and 60 days. See the difference?
⚠️ Warning: Revisit this audit quarterly. Consumer preference shifts and commodity swings make last quarter’s hero item this quarter’s drag. A 90-day cadence keeps surprises out of your walk-in.
Supplier Renegotiation Playbook
Menu clarity sets the target. Procurement hits it. The hard choice in 2026 is when to stick with a broadliner and when to pivot some categories to local or regional suppliers. The right answer is not ideological, it is arithmetic, and it starts with supplier renegotiation that prices volatility into your agreements.
Start with true cost-per-usable-unit, not case price. For proteins, model trim yield, shrink, and freight in dollars per gram plated. For produce, factor spoilage by day of week and delivery minimums. For dry goods, compare pallet breaks and storage constraints. Then add tariff and fuel exposure. During 2025, operators contended with tariff noise and freight volatility that often erased headline discounts, the Restaurants Canada Q4 report linked those headwinds to margin pressure persistent into 2026. Your job is to price the volatility, not ignore it. (restaurantscanada.org)
When does local actually save money? Three patterns recur:
- Short-haul freight where diesel surcharges erase broadliner price advantages.
- High-trim proteins where a regional cutter delivers superior yield at a slightly higher case cost but lower plated cost.
- Peak-season produce, especially when weekend delivery minimums from national suppliers force over-ordering and waste.
Imagine two scenarios for skin-on halibut. Broadliner price is lower on paper, but yield dips 8% and deliveries only land Monday and Thursday. A regional supplier, priced 4% higher per kilogram, trims to spec and delivers Tuesday, Friday, and Saturday. On a menu anchor moving 80 portions per week, the local option reduces waste enough to drop your plated cost by 30–40 cents. Across a month, that is rent money.
Before-and-after snapshot:
- Before: One broadliner, monthly pricing calls, over-ordering to meet delivery minimums, Thursday spoilage runs.
- After: Broadliner for center-store and high-volume SKUs, local for trim-sensitive proteins and peak-season produce, smaller but more frequent drops to match weekday lunch demand.
To prepare the negotiation, capture two weeks of theoretical versus actual food cost variances by category. Bring that to your supplier and request either (a) yield-verified cuts or (b) split loads that match your daypart strategy. You are not just buying food, you are buying fewer surprises.
If you need help mapping which competitors set your pricing ceiling in each category, this breakdown of how to track competitor pricing and marketing without expensive tools is a practical reference, and a quick SWOT refresh can sharpen your asks in the room: how to do a competitor SWOT analysis.
Labor Cost Defense
Labour is the line item with the most “hidden swing.” Schedule too early and you sit on idle hours. Schedule too late and overtime piles up. The fix: better forecasting, smarter scheduling, and light-touch automation where it delivers measurable variance reduction on restaurant labor cost.
Start with scheduling software that enforces rules you define: forecasted covers by hour, role-based labour targets, and automatic alerts when managers exceed thresholds. Some platforms include tip pooling, shift-bid marketplaces, and integrations to your POS and payroll so yesterday’s reality informs next week’s plan. Deloitte’s 2025 research on AI in restaurants described exactly this shift, where scheduling and inventory forecasting become the first credible use cases that move margins, not just dashboards. The theme is clear: operational discipline plus the right tooling trumps one-off heroics. (deloitte.com)
Cross-training is the force multiplier. One barback who can run food, one host who can close to-go, one line cook who can float hot and cold stations. That flexibility lets you defend weekday lunch with a smaller roster, then flex at 5 p.m. without overtime.
What about automation? Keep it practical. A kitchen display system that removes ticket confusion and reduces comps is more valuable than a shiny toy. A self-serve QR for patio ordering that smooths spikes at 5:30 p.m. might prevent a second server on Tuesdays. POS modernization pays when it reduces double entry and eliminates end-of-night reconciliation chaos, not because it looks modern. In Canada, both operator surveys and industry commentary point to a rising share of teams planning staff-productivity tool upgrades, a sign that measured tech bets are becoming standard. (fintech.ca)
Comparison snapshot to guide tool conversations:
| Scheduling Tool | Cost Savings | Implementation Time | Ease of Use |
|---|---|---|---|
| 7shifts | Moderate (3–5% fewer labour hours vs. baseline, operator-reported) | 1–2 weeks | High |
| Agendrix | Moderate (2–4% fewer hours through tighter shift alignment) | Under 2 weeks | High (agendrix.com) |
| Sling | Low to Moderate (1–3% through conflict reduction and better communication) | Under 1 week | High |
| Homebase | Low to Moderate (1–3% via schedule templates and clock-in controls) | 1 week | High |
Note: Ranges reflect operator-reported outcomes in Canada and U.S. markets, and they depend on adoption quality and POS integration. For the “do this today” version, set a 90-day test: lock role-based labour targets by hour for lunch and happy hour, enforce schedule freeze 48 hours prior, and measure overtime and comps before and after. Then decide what sticks. For broader productivity tactics that transfer beyond restaurants, BDC’s practical guidance on small, low-cost process changes is worth a scan. (bdc.ca)
With labour stabilized, you can attack the next blind spot: underused hours.
Daypart Strategy
Most independents defend dinner and surrender lunch. That is upside left on the table. The weekday lunch crowd in 2026 wants speed, clarity, and value. Build a small, fast line of three to four mains that share a prep tree with your dinner all-stars, a tight combo that lands under a psychological price point, and a 25-minute table turn target. For happy hour, focus on high-contribution bar bites and a short list of beverages where pour cost and prep time are predictable. Think of it as exporting your greatest hits into daytime packaging.
The Montreal bistro attention loop we analyzed this spring offers a second lesson: category benchmarks matter more when diners are choosy. In that cohort, tartare became a value and quality benchmark across platforms, and the bistros that priced and plated it with confidence earned outsized attention relative to peers. The message for lunch and happy hour is to define your benchmark items and lead with them, not bury them. Source: Aurevon Intelligence Service analysis, Canadian food service SMB, March 2026.
If you need a primer on who you really compete with at noon versus 7 p.m., revisit this guide on identifying your real competitors. Daypart competitors often differ from your dinner peer set.
To anchor expectations for 2026, here is a quick benchmark comparison. The point is not to copy chains, it is to know the gap you must close with tighter execution.
| Operator Type (Canada) | Typical Net/Operating Margin | Notes and Sources |
|---|---|---|
| Independent SMB restaurants | ~4.1% operating profit margin (2024 average) | Sector-wide StatCan result for food services and drinking places. (www150.statcan.gc.ca) |
| National chains (corporate consolidated) | ~8–13% net margin range | Illustrative range based on public-company filings for Canadian-headquartered chains (e.g., Restaurant Brands International TTM/FY 2025 ~8–11% and MTY Food Group FY 2025 ~10%). Consolidated, not unit-level. (stockanalysis.com) |
What does this mean for you? Your path to the right-hand column is not price hikes alone. It is lunch that prints cash, a bar program that moves high-contribution items, and a dinner menu that carries its weight.
Common Questions About Restaurant Margin Defense
What is the ideal food cost percentage for restaurants?
For most Canadian concepts, 28–35% is a practical target, but the right number depends on your category, price point, and labour mix. A pizza program with high throughput can live higher on food cost if labour is low and the oven never sleeps, while a steakhouse must keep yield and trim under tight control. Tie your target to contribution dollars and prep time, not just percentage, and revisit it whenever supplier prices or guest behaviour shifts. Statistics Canada’s updates on restaurant inflation are a useful gut check when deciding whether you have room to nudge prices or need to chase cost instead. (www150.statcan.gc.ca)
What is a healthy restaurant profit margin?
A healthy margin depends on concept and scale. Many independents land near 3–6% operating margin in normal conditions, while sector-wide results averaged about 4.1% in 2024. Multi-unit and corporate groups can post higher consolidated net margins, but that is not a unit-level target. Focus on lifting contribution margin per item, tightening waste, and stabilizing labour to push your Canadian restaurant profit margin into the healthy band for your category. (www150.statcan.gc.ca)
How do restaurants survive inflation?
Survival is about habits, not hope. Pair menu engineering with firm pricing guardrails, run supplier renegotiation with yield and freight math, lock weekday lunch and happy hour into your calendar, and treat automation as a variance-reduction tool. Monitor CPI and menu-price moves monthly so you adjust early, not late. Statistics Canada and the Bank of Canada both provide timely context that should inform your playbook. (www150.statcan.gc.ca, bankofcanada.ca)
What menu changes save money?
- Retire low-velocity dishes with high prep time and high waste, then redirect labour to items with stronger contribution.
- Right-size portions where guests will not notice, and standardize plating to cut variance.
- Cross-utilize proteins and sauces across dayparts, and simplify single-use garnishes.
- Swap to seasonal or local inputs when they lower plated cost after yield and freight.
- Use a rotating “one-pan” or “set menu” format one or two nights a week to streamline stations.
How can I effectively negotiate with suppliers?
Walk in with your math. Bring two weeks of variance reports that separate price from yield and waste. Ask for spec-verified cuts or smaller, more frequent drops that match your daypart plan. Price freight and tariff exposure explicitly. Restaurants Canada’s late 2025 analysis tied trade frictions and operating cost spikes to margin pressure heading into 2026, which is leverage for flexible terms. Consider a split model: broadliner for center-store and commodity SKUs, local for trim-sensitive proteins and peak-season produce. Then set a 60-day re-evaluation date with mutually agreed KPIs, such as shrink or on-time delivery. (restaurantscanada.org)
What are the best tools for labor optimization?
Look for scheduling platforms that do four things well: POS-integrated forecasting by hour, role-based labour targets, easy shift swaps with audit trails, and overtime alerts before the pain starts. Pair them with kitchen display systems that reduce ticket times and re-fires, and with mobile ordering or QR for high-friction patios. Deloitte’s research highlights scheduling and inventory as credible first-step use cases for AI in restaurants, because they turn messy, recurring decisions into repeatable habits. That is where ROI shows up. (deloitte.com)
How can I encourage more lunch traffic?
Package value without training guests to wait for discounts. Offer a short set of lunch plates that reuse dinner prep, a combo that lands under a visible price threshold, and a “ready in 10 minutes” promise for two items. Run it Tuesday to Friday, backed by a tight social cadence that shows the plates and the clock. For happy hour, lead with two or three high-contribution bar snacks and one house cocktail that travels. If you are unsure whom you are stealing share from at noon, study the near-field set with this practical method for tracking competitor pricing and marketing.
Take one action today: export the last 90 days of tickets, rank your top 30 items by contribution dollars, and circle the bottom 10 that also take more than 10 minutes to execute. That is your first menu workshop.
How to Identify Your Real Competitors and Competitor SWOT can sharpen your daypart plan and messaging.
Final note on the macro environment: CFIB’s recent materials show cost constraints, including fuel, still biting SMEs. While you cannot control macro inputs, you can control how often they surprise your P&L. Build the cadence now. (cfib-fcei.ca)
To go deeper on the cost and demand forces shaping your neighbourhood in 2026, consider commissioning a concise market scan that translates signals into moves. Aurevon’s Ecosystem Dynamics Report packages local demand shifts, competitor pricing patterns, and supply-side risks into a 15‑page playbook you can act on in a week. Learn more here: Ecosystem Dynamics Report.
Mitchell Ozmun
SMB Researcher, Business Analyst - Saskatchewan Born and Raised