How toronto vintage retail uses curated narratives in 2026
A teen tries on a Y2K jacket. Checks the tag. Winces. Phone comes out. A quick price search. A glance at ratings. The jacket goes back. That sting is the new normal. For toronto vintage retail, the path through it is not louder racks or cheaper bins, but sharper vintage retail curation and clearer retail storytelling that justify price and win reviews.
Gen Z’s deal-hunting and rating habits are pressuring open-ended browsing formats. Shops that operationalize curation across assortments, pricing bands, and in‑store narratives are converting that pressure into loyalty. The shift is local and measurable in Toronto retail, not just a social feed aesthetic.
Related: How to Start a Thrifting and Reselling Small Business — Caroline
How Toronto vintage retail worked: the high-volume treasure-hunt model
For decades, the city’s vintage scene ran on density. Think shoulder‑to‑shoulder racks, overflowing tables, and a “dig to discover” culture that pulled weekend foot traffic across Kensington Market and Queen Street West, two of the most visible Toronto shopping districts. The operational math was simple: wide SKU counts, low price per item, slower turns tolerated, and margin made on volume and lucky finds. Abundance did the talking.
That formula now meets a different shopper cadence. Gen Z arrives with saved searches, a mental price ceiling, and a bias toward stores that make value obvious. Choice overload turns excitement into fatigue. When provenance stories are verbal, not visible, staff become the bottleneck. And when two similar jackets carry different prices without an explanation, the cheaper online tab wins. The irony: high volume often hides value, which triggers price complaints and lower review scores.
Local conditions reinforce the shift. Downtown recovery data shows visits remain uneven by district, so relying on casual browsing is risky for SMBs that must protect turns and wage budgets. Foot traffic is coming back, but not evenly enough to carry inefficient floorsets. A thinner, sharper edit can punch above its size when fewer visits must yield more conversions. See how that reframes the job?
As you reframe, map who really competes for your next sale. Use a light exercise like how to identify your real competitors so your curation answers the right rivals, not yesterday’s. This is the heart of vintage retail curation that actually moves numbers, not just aesthetics.
Gen Z behavioral drivers: price sensitivity, ratings, and preference for narrative
Price sensitivity shows up in the micro‑moments. Many younger shoppers anchor on platform prices and expect in‑store clarity that matches. They search for deals, compare quickly, and reward transparent ranges over mystery tags. Bank of Canada expectations work shows consumers carried elevated price concerns into 2025, which hardened value‑seeking habits. When shoppers expect higher prices, they plan and scrutinize more, not less. That matters for your margin math. Bank of Canada consumer expectations and Deloitte’s 2024 Holiday Retail Outlook both documented a “search for value” mindset, with many consumers anticipating higher prices and tightening spend. In short, consumer price sensitivity is a rational response to inflation memory, rapid price comparisons on mobile, and budget discipline in a period of cautious Canadian consumer spending.
Ratings are the second price tag. Gen Z filters by stars, reads “overpriced” and “great value” comments, and expects condition and authenticity cues to be consistent across channels. Reviews do not just reflect satisfaction, they shape discovery, which then shapes traffic. One frank way to see ratings is a thermostat for trust: if your stories and prices do not match, the room gets cold.
Narrative preference is the third force. Younger shoppers buy edits, not bins. They follow micro‑trends, pay modest premiums for “the story makes sense,” and expect stylistic cohesion that reduces decision friction. Sustainability weight matters too. Deloitte’s global Gen Z and Millennial research notes these cohorts align purchases with values like climate impact, which means visible repair, reuse, and sourcing stories earn attention and forgiveness on price when credible. Deloitte’s global Gen Z and Millennial survey
What attracts Gen Z to vintage retail is a tight blend of uniqueness, credible sustainability signals, and clear price logic that fits their Gen Z consumer behavior and broader gen z retail trends. What does this mean for you? Treat price bands and visible stories like transit zones and signs. Clear zones reduce fare disputes. Clear stories reduce price fights.
To keep your edits pointed at real rivals, pair curation work with a lightweight competitor SWOT analysis so your floor tells a differentiated story, not a generic one.
Proprietary evidence: what Aurevon Intelligence Service analysis (Canadian retail SMB, March 2026) shows
Across 5 Canadian retail business SMBs analyzed via the Aurevon Intelligence Service, value‑seeking and rating‑driven behavior among Gen Z correlated with stronger performance for stores that used visible condition tags and simple price bands. In the same sample, Google rating medians across 4 businesses were 4.6 with a p10–p90 range of 4.16–4.67, and median review counts were 682. That narrow rating band means small narrative improvements can swing visibility and conversion. When we run intelligence reports for Canadian retailers, a consistent theme appears: structural traffic pressure and direct‑to‑consumer undercutting reward stores that make value legible on the rack, not just online.
This is why curation must be operationalized. It is a margin and reputation lever, not an aesthetic choice. In practical terms, curation affects retail success by reducing choice overload, clarifying value on the hanger, lifting conversion, and improving review language.
| Dimension | High-volume treasure-hunt model | Curated story-driven model | Practical change to implement |
|---|---|---|---|
| Pricing | Item-by-item, inconsistent | Simple bands tied to condition/provenance | “Local Finds $30–$70, Classics $80–$200,” posted on shelf |
| Provenance | Verbal, ad hoc | Visible tags with era, origin, repairs | SKU-level story cards and QR for details |
| Assortment | Max SKUs, overlap | Tight edits by theme or micro‑trend | 10–20 item capsules refreshed weekly |
| Reviews | Reactive | Proactive prompts tied to stories | QR on tags with review ask and care tips |
Traffic still matters, but it is more variable by district. University of Toronto’s downtown tracker shows recovery remains uneven across cities and corridors, which raises the bar for each visit to convert. School of Cities downtown recovery
Place-based examples: how Kensington Market and Queen Street West are adapting
Consider a Kensington Market operator that trims three packed racks into a “90s Campus Core” capsule with posted bands and visible condition grades. Before: shoppers browse for 20 minutes, try two items, and many leave after a phone‑search shock. After: they understand why a repaired varsity jacket sits at $120 and a lighter‑wear hoodie at $65, and conversion edges up because the value story is already on the hanger.
On Queen Street West, a shopping strip that once relied on basement‑style treasure hunts, imagine a shop that now runs monthly “Toronto Night Out” edits timed to gallery openings, with a small rail of sequined tops and tailored trousers, every tag stamped with origin and repair notes. Fewer browsers, better fits. Conversion rises, and “overpriced” disappears from recent reviews. That changes things.
Local fixtures set the scene for these moves. Long‑running Kensington institutions such as Courage My Love anchor expectations about craft and character, while Queen Street West stalwarts like Black Market position streetwear basics at scale. Neither approach is right for every block. Tourism‑heavy strips benefit from theme-based edits that photograph well for visiting shoppers, while neighborhood stores win with condition transparency and style coaching for repeat locals.
Two cautions from our field notes: first, curation that hides bargains can backfire if value bands are not posted. Second, provenance copy that feels invented will be punished in reviews. Keep it factual, short, and visible. To monitor who sets the reference price on your block, use this no‑software primer on tracking competitor pricing and marketing.
Current trends in Toronto’s vintage market include themed capsules tied to micro‑events, visible condition grades, simple price bands, QR-linked provenance cards, and edits aligned to neighborhood footfall patterns. These mirror broader vintage retail trends in Canada while reflecting the nuances of Kensington Market and Queen Street West shopping behaviors.
Operational curation and storytelling tactics vintage SMBs can implement today
Start with inventory triage. Pull the top 15% by margin potential or uniqueness into a capsule. Give each item a condition grade (A/B/C), a one‑line provenance, and a price band. Use a simple pricing rule so staff can move fast: condition plus band equals sticker. Add a tiny QR that opens a care tip and review prompt. Think of it like releasing a curated playlist instead of handing someone your entire music library. This is a retail inventory management move that also strengthens retail storytelling.
Process changes keep it repeatable. Create a two‑page condition template so grades are consistent. Print band signage and a one‑page style map per capsule. Write a 30‑second staff script that links story to price. Build a ratings‑response playbook that answers “overpriced” with clarity about condition, repairs, and local sourcing rather than defensiveness.
Align digital and in‑store. Film 10‑second clips that show a single item’s origin, repair, and how to style it, then pin those to capsule rails with QR codes. Use A/B week tests: one week of dense racks, one week of the capsule, then compare conversion, average sale, and rating comments. To sanity check your edits against the competitive set, revisit how to identify your real competitors and refresh your competitor SWOT.
| Tactic | Estimated cost | Implementation effort | Expected short-term impact |
|---|---|---|---|
| Post price bands on shelves | $30–$60 for signage | 1 day | Fewer price complaints, faster decisions |
| SKU story tags with condition | $0.05–$0.15 per tag | 1–2 days batch | Higher perceived value, more reviews |
| 10–20 item themed capsule | $0 if using stock | 1 day curation | Higher conversion, cleaner photos |
| QR to care tips and review ask | Free with basic tools | 2 hours setup | More 5‑star detail, fewer returns |
| Weekly A/B floorset test | Staff time only | Ongoing | Data‑driven proof for what to scale |
💡 Pro Tip Start with one “story shelf” of 10 items and track conversion and review language for 30 days before scaling. Low risk, high learning.
To guard margin while shoppers hunt for value, watch e‑commerce context. StatCan shows online’s share of retail hovering near the high single digits into early 2026, which means in‑store trust still decides many buys, especially for tactile goods like vintage. Make that trust visible on the rack. Statistics Canada e‑commerce share
Answering Toronto vintage retailers’ practical questions
How do I price items so Gen Z sees value without eroding margins?
Use simple price bands tied to condition and provenance (for example, Local Finds $30–$70, Curated Classics $80–$200). Document condition and associate each band with a margin floor. Test a 10–20% premium for items with a short provenance card or a staff‑curator badge, measure conversion and ratings, and keep the bands visible in‑store and online.
Won’t curation reduce foot traffic if people can’t “dig” for bargains?
Expect a change in mix: slightly fewer casual browsers, more qualified shoppers. Offset with themed drops and small community events that create reasons to visit. A tighter edit shortens time‑to‑purchase and encourages repeat visits when paired with visible bands and a monthly capsule reveal.
How can a one‑ or two‑person shop operationalize storytelling without hiring staff?
Make storytelling repeatable. Use template provenance cards, modular display kits, and a short script staff can use at the till. Batch 30–50 single‑item social posts in one sitting, then schedule, and reserve full story treatment for the top 20% of inventory by margin or uniqueness.
What short‑term metrics should I track to know curation is working?
Track conversion rate, average sale value, 30‑day sell‑through, ratings, and repeat‑visit rate. Run a 30‑day A/B test: one week with traditional racks, one week with curated edits, then compare those metrics. Pair that with a weekly scan of rivals using this playbook on tracking competitor pricing and marketing.
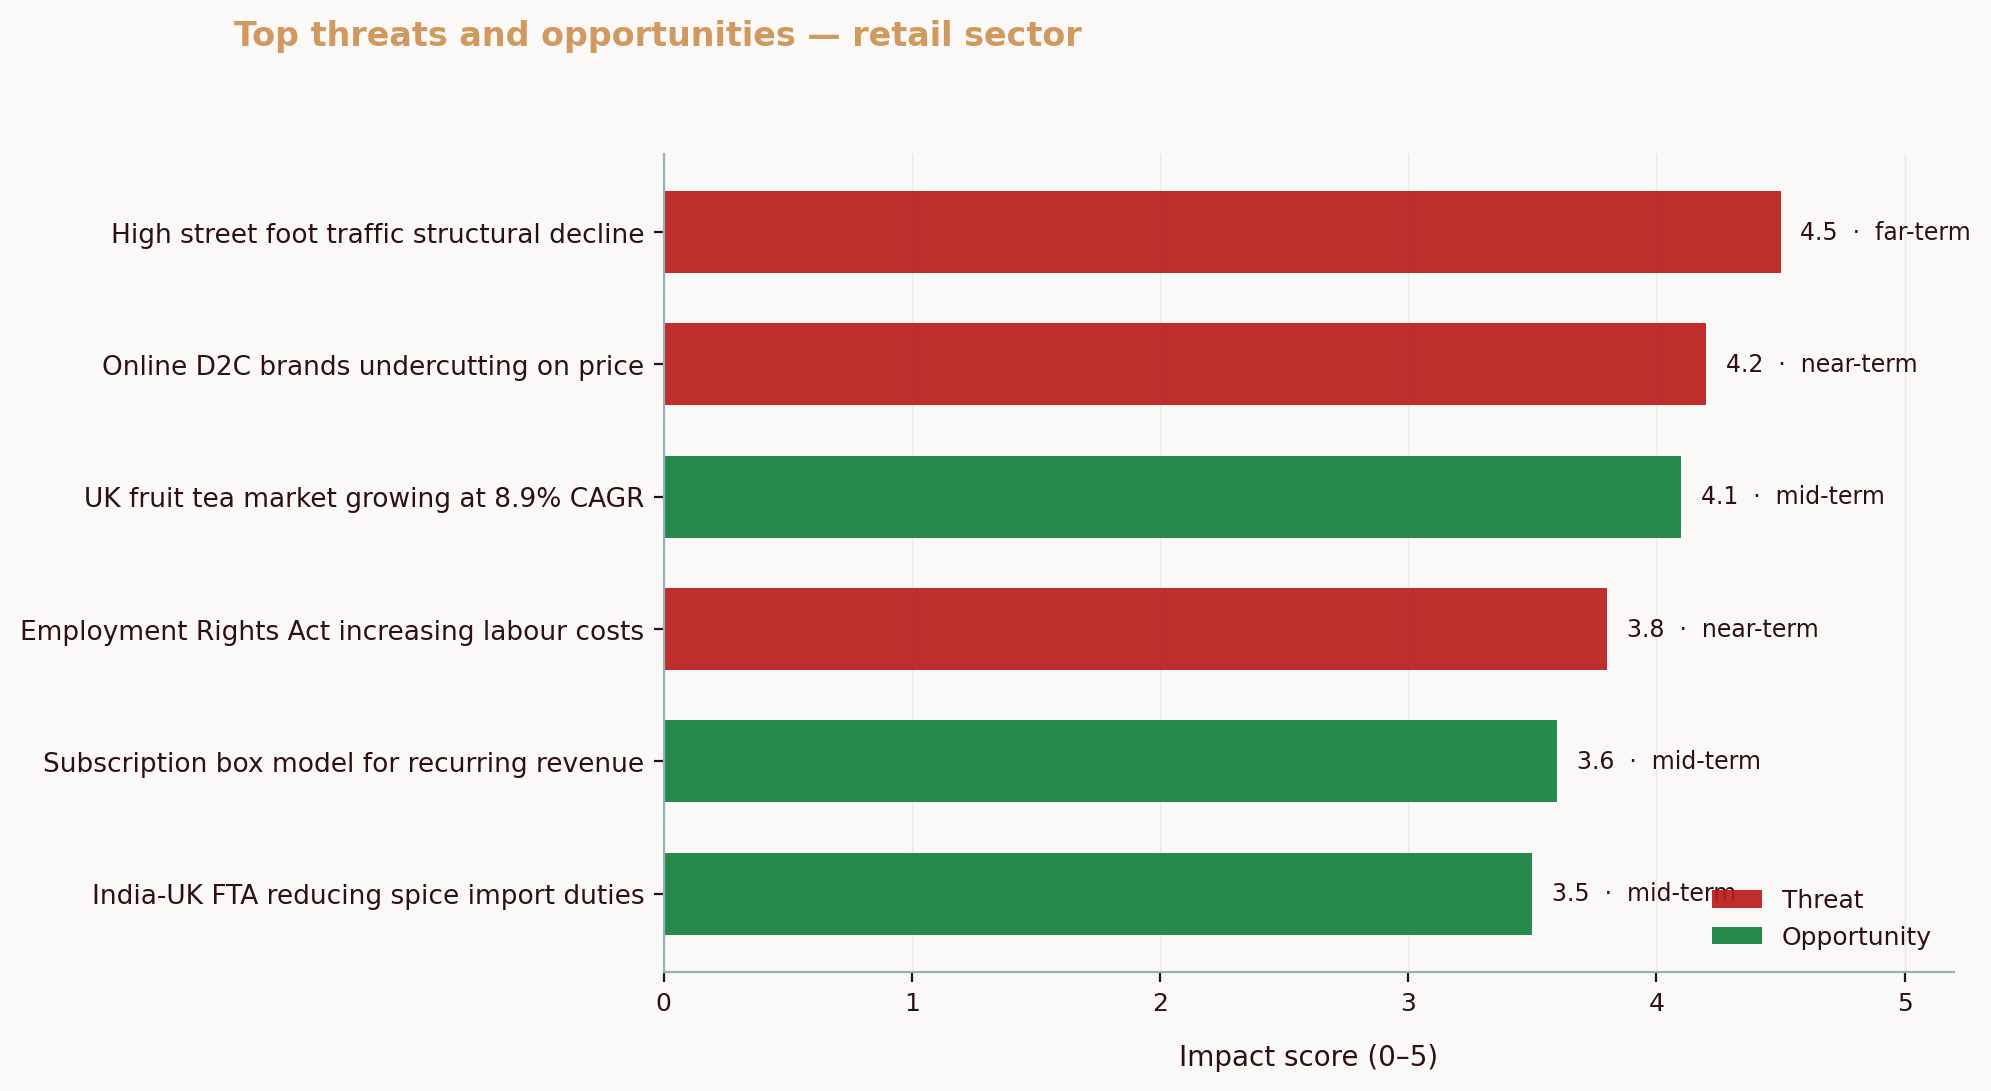
A final note on context: across our SMB samples, “Experience‑driven community retail” appears as a recurring opportunity, while “Erosion of in‑store traffic” and “Direct‑to‑consumer price undercutting” persist as threats. That explains why story‑led value signals matter so much right now. Deloitte consumer trends adds a digital layer: discovery starts online, but the in‑store experience still seals trust on tactile goods.
If you want a deeper local cut on these shifts, our Ecosystem Dynamics Report distills neighborhood‑level signals into practical moves for SMB retailers. Learn more at aurevon.ca and see how a Toronto‑specific view can sharpen your next capsule.
Mitchell Ozmun
SMB Researcher, Business Analyst - Saskatchewan Born and Raised