How to Raise Restaurant Prices Without Losing Canadian Customers in 2026
Guests open the menu. Their eyes snag on a favourite. Price jumps. Forks pause. Conversations stall. That’s how an across‑the‑board 8% hike feels in the room: obvious, personal, and a little like a broken promise. If you’ve absorbed two years of rising costs, you need relief. But you also need Tuesday lunch regulars to keep coming. Here’s how to raise restaurant prices without losing customers: move from blanket hikes to surgical, item‑level changes guided by contribution margin, frequency, and substitution risk, then roll those changes into a predictable 60‑day menu refresh that resets reference points.
The counterintuitive part? Lift only the items that can carry it. Add a few well‑priced newcomers so the story is “new menu” rather than “more expensive menu.” Spread small changes through time instead of one painful leap. Quarterly 2–3% selective nudges will beat one annual 8% blunt move, both in optics and in margin retained.
Related: 3 Best Restaurant Marketing Ideas for 2025 (with AI Strategies) — Learn with Owner.com
Why blunt, across-the-board price hikes fail
Uniform increases trigger reference‑price alarms. Regulars remember the $18 burger that’s now $19.50 and mentally compare today’s check to last month’s. People don’t memorize every line item, they track the hits they order most. When everything climbs at once, it looks coordinated and intentional. The social feedback loop kicks in as well: staff spend the week fielding the same complaint, and a single irritated post can set the tone for a neighbourhood.
The math undermines you too. An identical percentage on low‑ and high‑margin items produces wildly different results. Suppose fries have a $1.00 margin and your signature bowl has a $7.00 margin. An 8% hike adds $0.24 to $3.00 fries and $1.52 to a $19.00 bowl. The guest notices the fries increase (it sits next to a known grocery price), but the extra $1.52 on the higher‑margin bowl, though better for you, piggybacks on the same sense of “everything went up.” Same percentage, different emotions.
There’s also less pricing room than many believe. Statistics Canada’s CPI shows prices for food purchased from restaurants rose 2.6% on an annual average basis in 2025, down from 2024, which means diners just lived through visible menu inflation and are primed to notice more. Push too hard and they trade down, defer, or defect. Consumer Price Index: Annual review, 2025. (www150.statcan.gc.ca)
So the risk is real. What can you do about it? You get selective.
Which menu items can absorb price increases (margin, frequency, substitution risk)
Start by sorting your menu through three lenses:
- Contribution margin: After food cost, how many dollars does each item contribute?
- Purchase frequency: How often do regulars buy it?
- Substitution risk: How easy is it for guests to replace it at your place or a competitor?
This is practical menu engineering, where you pair margin data with price elasticity and menu psychology so the right items move and value anchors stay put. High‑margin, high‑frequency, low‑substitution items are your best candidates for 5–8% increases. Think signature mains served with a unique house sauce, or a beloved grain bowl built on prep you already batch. Upgraded beverages (single‑origin drip, nitro cold brew) can also carry a small lift because they’re anchored to a differentiated experience. On the other hand, commodity side items and branded sodas usually cannot. Guests benchmark them to grocery prices or dollar‑menu memories, making anything above 2–3% feel like gouging.
One shift is enough to build an actionable list. Here’s a quick screening process:
1) Pull a 90‑day POS report of item sales, contribution dollars, and discount activity.
2) Sort by contribution dollars, then filter for items purchased at least weekly by your top 200 customers.
3) For the top 20 items, score substitution risk: “low” if the flavour profile, portioning, or plating is hard to find within a 10‑minute walk, “high” if two nearby competitors carry near‑identical options.
4) Flag 6–10 items with the strongest margin and lowest substitution for a test lift.
5) Place commodity items (fries, soda, kids’ staples) in a 2–3% band or hold flat, and augment them with bundle value instead.
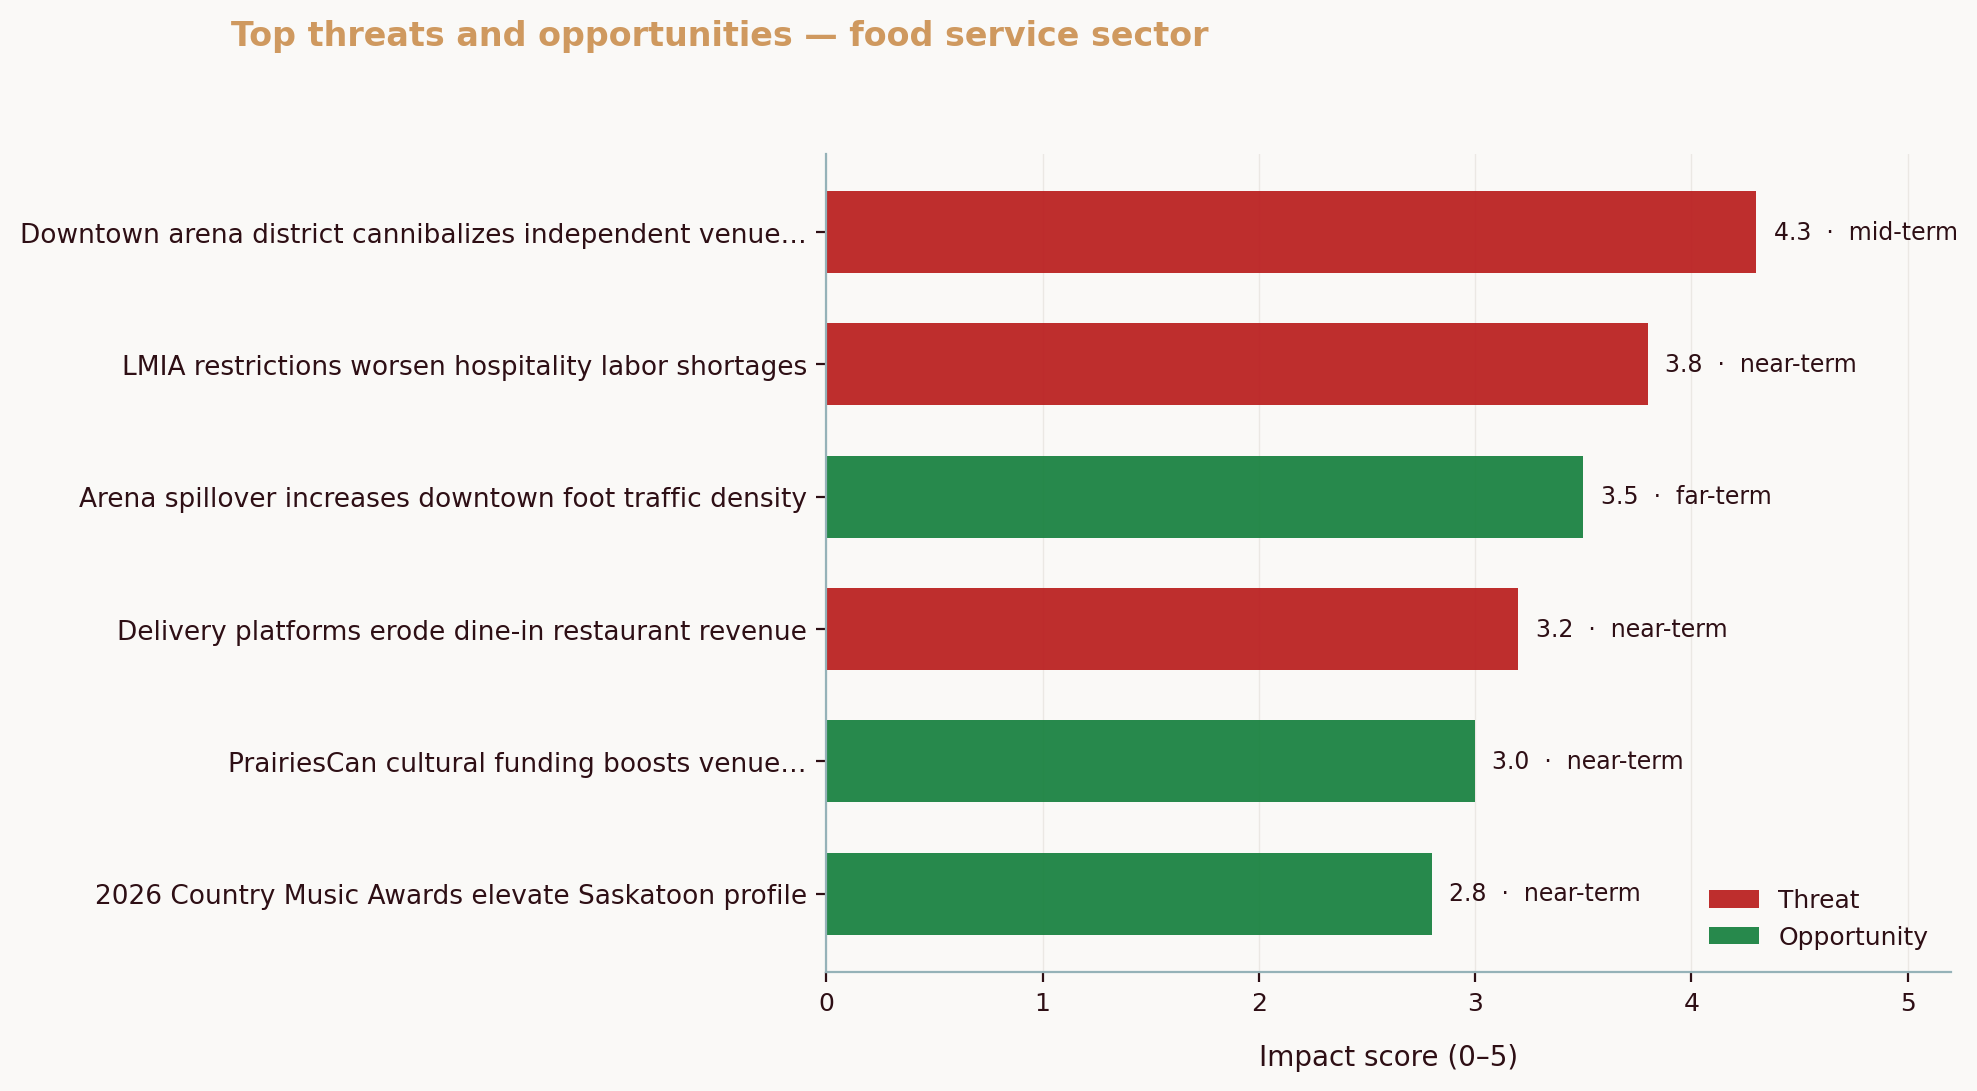
Across 83 Canadian restaurant SMBs analyzed via the Aurevon Intelligence Service, the recurring drag on pricing power isn’t always cost, it’s discoverability. Venues with near‑zero reviews and lower average ratings struggle to appear in local search, which depresses trial and makes any visible hike riskier. Review leadership, by contrast, boosts conversion and gives owners more room to defend modest increases with evidence of quality. That theme appears alongside rising input and labour cost pressure as top threats in our sample. Build pricing moves on top of a clean reputation base and you’ll get fewer hard objections and more quiet acceptance.
💡 Pro Tip
If you have POS sales data but not margin data, start by ranking by frequency and average check contribution. Frequency is a quick proxy for price stability while you catch up on costing.
Below is a fast way to translate those lenses into tactical choices.
| Item archetype | Examples | Contribution margin | Substitution risk | Recommended increase (%) |
|---|---|---|---|---|
| Signature mains with unique build | House curry, chef’s hot sandwich, seasonal gnocchi | High | Low | 5–8 |
| Upgraded beverages/desserts | Single‑origin drip, nitro cold brew, house tiramisu | Medium–High | Low–Medium | 4–6 |
| Popular sides with twist | Smoked‑paprika fries, maple‑roasted carrots | Medium | Medium | 3–5 |
| Commodity add‑ons | Plain fries, canned/bottled soda, white rice | Low | High | 0–3 |
| Kids’ anchors/value staples | Grilled cheese, fountain soda, basic salad | Low | High | 0–2 |
What does this mean for you? You’re not trying to move everything. You’re trying to move the handful of items that carry your check while protecting the items that define value perception.
As you hone price targets, keep an eye on the local battlefield. If your nearest five rivals are discounting or bundling heavily, shore up your “why us” with distinct positioning and basic intelligence: know who you really compete with, not just who you assume. A quick refresher on how to identify your real competitors will keep you from calibrating against the wrong benchmark.
How large to raise each category: surgical percentage bands by item type
Now translate your short list into precise bands that protect perceived value:
- High‑margin, high‑frequency, low‑substitution: 5–8%. These are items where brand, prep method, or garnish tells a story. Pair the lift with a small portion or plating improvement and a new photo on the menu.
- Mid‑margin or occasional items: 3–5%. Keep the lift modest and bundle them with a value side or a free add‑on during the first two weeks.
- Commodity or price‑sensitive items: 2–3% max. If you must move them, use rounding tactically to soften the visual: $3.00 to $3.09 reads gentler than $2.89 to $2.99.
Rounding matters because it steers attention. Move to .75, .95, or .99 endings based on category norms in your neighbourhood. This is price anchoring and menu psychology at work. Anchor prices with a visible “hero” that stays flat for the cycle. If your $18 burger is the magnet, leave it at $18 this round and move the $17 pasta to $17.75. The burger’s stability shields the menu’s perceived fairness.
Test before you commit everywhere. If your POS supports it, A/B two menu inserts for a weekend or pilot the lift for 30–60 days in one location or daypart. The Bank of Canada’s surveys repeatedly note that weak demand and competition can limit firms’ ability to pass through costs, which is why a pilot beats a system‑wide flip when your read on elasticity is uncertain. Business Outlook Survey, Q2 2025. (bankofcanada.ca)
One more lens: consumer price sensitivity is higher when wallets are strained. Restaurants Canada reported in 2025 that three in four Canadians were dining out less due to cost of living pressure, which means your increases compete with a stronger “stay home” impulse. That doesn’t mean you can’t move. It means your move must come with a value story and a cadence that avoids headlines. 2025 Foodservice Facts report. (restaurantscanada.org)
If keeping tabs on neighbour pricing is hard, schedule a monthly hour to compare public menus and promos and log them in a simple sheet. This is the no‑tools path to tracking competitor pricing and marketing without getting lost in the weeds.
Menu refresh as cover and cadence: redesign, new items, and a 60‑day rhythm
With targets set, make the timing feel like a menu story rather than a price story. A light redesign and 2–3 new items reset customer reference points and pull the eye to what’s changed in format and content, not just in numbers. This isn’t about hiding. It’s about context. When you rotate a seasonal feature, swap layout blocks, and reposition your price anchors, small lifts land as part of a living menu.
Work in a predictable 60‑day cycle. Every refresh, change two or three elements: highlight boxes, photography, category order, or the way you name sizes. Add 1–2 new items at the target price points you want guests to accept going forward. Retire one underperformer. The result is a gentle rhythm that teaches regulars to expect evolution, which lowers the shock of any single adjustment.
Keep operations tight. Align kitchen prep sheets and POS buttons two days before the refresh, and brief staff on what’s new and what moved. If your venue uses chalkboards or a specials insert, park the highest‑lifted item there for two weeks with a flavour‑first headline (“Citrus‑herb chicken with roasted fennel”) so the first conversation is about taste, not cents.
Here’s a 60‑day cadence checklist you can repeat:
| Refresh element | Why it matters | Action (owner/manager/designer) | Timing within 60‑day cycle |
|---|---|---|---|
| Price anchors | Sets “normal” for the category | Keep 1 hero item flat, adjust neighbours | Day 1 |
| Layout order | Guides attention top‑left to bottom‑right | Swap one category’s position | Day 1 |
| New items | Creates fresh reference points | Add 1–2 items at desired price | Days 1–7 |
| Photography/icons | Draws the eye to value and novelty | Update 2 visuals or add icons | Days 1–7 |
| Specials insert/chalkboard | Softens scrutiny on small lifts | Feature 1 lifted item with story | Days 1–14 |
| Staff briefing | Controls the guest narrative | Script two talking points and one suggestion | Day 0 |
| POS review | Prevents comp/misring losses | Audit price keys, bundles, taxes | Day 0 |
| Mini‑postmortem | Locks lessons for next cycle | Review sales/margins/complaints | Days 40–50 |
So what does this actually look like in practice? In one anonymized mid‑market venue from Saskatoon, a staged approach over 18 months increased average ticket by 11% while weekday traffic held essentially flat. The pattern: they lifted 6–8 items by 4–6% in Q1, launched two new seasonal mains at the new anchor price in Q2, then repeated on a 60‑day beat with minor layout shifts. They paired each price nudge with one incremental value cue (more visible local sourcing, plated garnish upgrades). That outcome comes from anonymized reporting in the Aurevon Intelligence Service. See the difference?
If you’re unsure which local rivals you should calibrate against before a refresh, revisit your map and check your assumptions with a quick competitor SWOT analysis. Owners often learn they’re pricing against the wrong set.
Communication strategy: when to be transparent and when to be quiet
Pricing is half math, half theatre. Quietly implement small, surgical lifts that sit inside normal rounding (2–3% on commodity, up to 5% on select mains) and let the refreshed menu carry the message. Save proactive announcements for two cases: when you’re moving a beloved staple by more than 5%, or when B2B clients and loyalty members deserve a heads‑up for budgeting. In those situations, your frame is consistency and quality, not “our costs went up.” Try: “To keep serving our house‑made burgers with AAA chuck and to pay our team fairly, we’re adjusting a few prices while adding new weekly features.” This is the practical side of how to communicate a price increase in your restaurant without turning it into a debate.
Coach staff to use a three‑line script: thank the guest for noticing, explain the value driver (quality, prep time, wage fairness), and steer to a well‑priced alternative if they hesitate. Don’t turn the table into a referendum on macroeconomics. The goal is to keep service warmth high while reducing friction in the moment.
If pushback spikes publicly, respond within 24 hours with empathy, one clear fact, and a small concession if warranted (e.g., a limited‑time add‑on for loyalty members). Then check the next day’s comp report to avoid panic reactions. CFIB survey data show average planned price increases hovering around 2.7–2.9% through mid‑ and late‑2025 among small businesses, which aligns with making selective moves rather than lurches. June 2025 Business Barometer and October 2025 update. (cfib-fcei.ca)
One last point: Canadians have grown more price‑conscious at restaurants as living costs rose. Restaurants Canada’s reporting notes broad consumer trade‑down behaviour, which raises the bar for your “why we’re worth it” message. Lead with quality and consistency, not sympathy. Foodservice Facts, 2025. (restaurantscanada.org)
Answering your questions about raising restaurant prices without losing customers
How much can a restaurant raise prices?
Use surgical bands built from menu engineering and price elasticity. High‑margin, high‑frequency, low‑substitution items can usually carry 5–8%. Mid‑margin or occasional items fit in the 3–5% range. Commodity or highly price‑sensitive items should stay at 0–3% with careful rounding and bundle value. Keep one visible hero item flat to preserve price anchoring, then measure conversion and attach rates for two weeks to confirm the lift is sticking. Bank of Canada survey work also notes that competitive pressure can limit pass‑through, which is why pilots are smart. Business Outlook Survey, Q2 2025. (bankofcanada.ca)
Should you tell customers about a price increase?
Tell customers proactively when a beloved staple moves more than 5% or when B2B and loyalty audiences need predictability. Otherwise, let a 60‑day refresh cadence and a clear value story do the work. Your communication strategy should be simple: thank them for noticing, link the adjustment to quality and fair pay, and guide to a great alternative if needed. This is a restaurant menu price increase strategy that maintains trust without inviting a public referendum. CFIB’s small‑business pricing intentions, hovering near 3% in 2025, support this selective approach. June 2025 Business Barometer. (cfib-fcei.ca)
When is the best time to raise menu prices?
Move during a positive review streak, or the month before your high‑demand season so regulars adapt early. Avoid periods of heavy economic anxiety in the news. Pair timing with a light redesign, two or three new items, and updated photography so the change reads as a living menu, not a price story. Statistics Canada’s CPI shows diners are already primed to notice increases, so context and cadence matter. CPI annual review, 2025. (www150.statcan.gc.ca)
How often do restaurants change prices?
Many independents find a 60‑day rhythm works, with small, selective lifts and a repeating checklist. Others adjust quarterly. The key is predictability and measurement, not a once‑a‑year lurch. Refreshing layout, price anchors, and one underperformer every cycle keeps perception fair while protecting margin in a restaurant pricing inflation Canada environment.
Before you roll your next change, lock your calendar. Move after a positive review streak or a local media pop when goodwill is high. Aim for the month before your high‑demand season so regulars adapt early. Not during a panic. During a quiet patch in the news cycle, especially when economic anxiety headlines spike. And if you’re deciding how to raise restaurant prices without losing customers, commit to the 60‑day rhythm and let the menu do the talking.
Ready for a deeper, neighbourhood‑specific view? Aurevon’s Ecosystem Dynamics Report distills competitor moves, local demand signals, and review dynamics into a pricing brief you can act on in a week. If that would help, learn more at https://aurevon.ca/ and decide if the timing fits your next 60‑day refresh.
Mitchell Ozmun
SMB Researcher, Business Analyst - Saskatchewan Born and Raised