The 8 Reports Canadian Restaurants Use to Decide Delivery in 2026: should restaurant add delivery 2026?
Friday, 6:12 p.m. The host says a walk‑in will wait 35 minutes. Expo calls for a re‑fire. Your phone pings: “Join our marketplace for 30% more orders.” Thirty percent of the cheque. Zero customer data. Packaging that dulls your plating and your brand. You feel the squeeze and the FOMO at the same time. The real question isn’t yes or no to delivery. It’s the math of what you’d give up to get it.
For operators asking should restaurant add delivery 2026, the right answer is a capacity and contribution problem, not a marketing decision. If your peaks already hit 75%+ seat and kitchen utilization and you’ve got dishes that travel with food cost under roughly 28%, delivery can monetize slack time without gutting margin. If your line is strained, average ticket sits under $25, or your magic comes from plating and the room, third‑party delivery will likely clip profits instead of growing them. With typical delivery aggregator fees and commissions between 15% and 30%, a dine‑in item at a 65% gross margin can slide into the mid‑30s after fees. That gap only works if the orders are incremental and operationally absorbable. (cnbc.com)
Related: 3 Best Restaurant Marketing Ideas for 2025 (with AI Strategies) — Learn with Owner.com
Aurevon’s 8‑report trade‑down reality: framing delivery as an opportunity cost
Across eight recent Canadian market reports from Aurevon, one consumer pattern keeps surfacing through 2026: diners trading down in format and occasion frequency, with limited‑service and off‑premise convenience picking up share while full‑service growth depends on events, groups, and special moments. National data points in the same direction. In Statistics Canada’s most recent annual read, limited‑service accounted for 46.6% of 2025 restaurant sales, outpacing full‑service, while price pressure remained a headwind for guests. That mix shift is the context for any delivery choice. (www150.statcan.gc.ca)
Treat delivery like a constrained resource allocation problem. You’ve got scarce seating, kitchen bandwidth, brand equity, and marketing spend. Redirect any of those, and something else gets less. The right approach is to quantify the opportunity cost: what contribution dollars do you give up in dine‑in to earn contribution from off‑premise, and when does that trade improve your P&L?
This article puts numbers to that question. You’ll get a five‑item checklist to baseline your operation, a copy‑and‑paste unit‑economics walkthrough, and a set of hybrid tactics that shift the math in your favour. If you want a deeper look at who you’re really competing with in your area while you run these numbers, use a simple framework like how to identify your real competitors and stress‑test your assumptions against nearby menus and formats.
Decision checklist: the five inputs you must quantify before modeling delivery
Start by measuring five inputs from your POS and daily reports. Each one changes the opportunity‑cost math.
1) Dine‑in capacity utilization. Pull hourly seat turns and ticket times for the last eight Fridays and Saturdays. If your peak hours run above 80% for seating and the line is consistently in the weeds, any delivery volume in those windows will cannibalize higher‑margin dine‑in and slow the floor. If peaks sit closer to 60–70% and weekdays have headroom, delivery can fill slack time without hurting the room.
2) Menu food cost percentage by item. For delivery‑eligible SKUs, target sub‑28% food cost, because aggregator fees and packaging will stack on top. That threshold isn’t dogma; it’s a line where contribution survives typical commission tiers. Build a short report on the top 15 menu items you think travel well and tag their food cost, prep complexity, and hold time.
3) Average ticket size. Under $20–$25 average order value, commission drag scales faster than contribution unless items bundle into meals. If you’re mostly single‑item, low‑ticket orders, you’ll need fees you control (own ordering or pickup) to make the math work.
4) Brand premium and price elasticity. Some brands sell the room as much as the food. If guests pay for experience, lighting, and service, off‑premise versions face weaker pricing power. Bank of Canada consumer‑expectations work through 2025 showed discretionary categories like restaurant meals staying subdued, which means elasticity can bite. Raise prices on delivery menus only where the brand can actually carry it. (bankofcanada.ca)
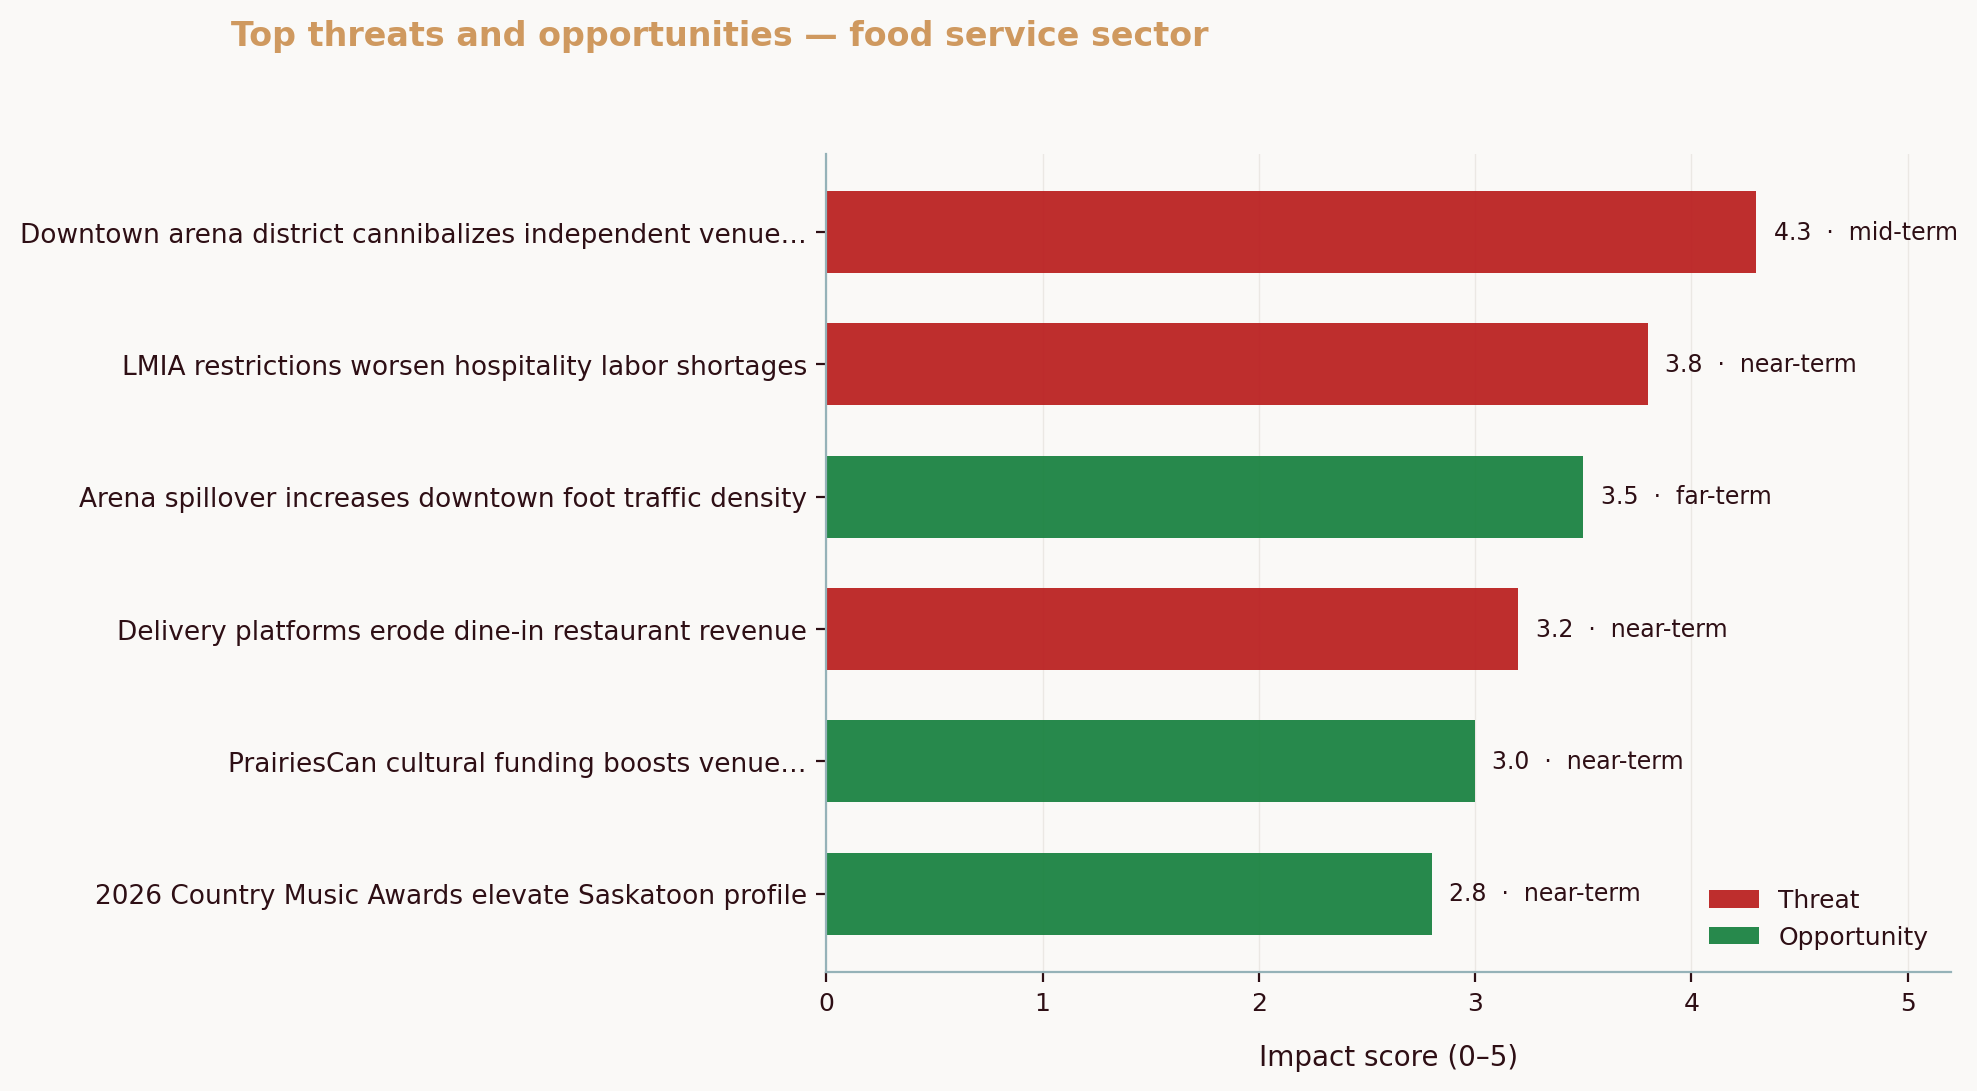
5) Kitchen labour headroom. If adding five orders per hour forces overtime or a new expeditor at peak, those costs belong in your delivery model. If you can batch and stage in off‑peak windows with the current crew, incremental labour per order is small. Across 80 Canadian restaurant SMBs analyzed via the Aurevon Intelligence Service, “rising ingredient and labour costs are compressing operator margins,” and “LMIA restrictions and tighter immigration enforcement are exacerbating hospitality labour shortages.” If labour is your bottleneck, off‑premise volume can break the line before it grows profit.
With these five quantified, you can stop arguing philosophy and start trading dollars. Want a quick gut‑check while you pull the data? Build a simple competitor view using a competitor SWOT analysis to see who in your trade area is already getting delivery right.
The math owners skip: unit‑economics walkthrough (replicable example)
Here’s how you actually run the numbers. You’re comparing contribution margin per order, dine‑in versus marketplace delivery. Contribution here means what’s left after variable costs tied to the order: food, packaging, aggregator commission, and any incremental labour.
Use this base case. Dine‑in average ticket is $30. Gross margin on that dish in‑house is 65%, which leaves $19.50 after food cost. Now run the same item on an aggregator at a 30% commission with $2.50 in packaging. Food cost stays the same for this example, though you should test a 1–2 point increase if delivery portions creep or you add sauces. Result: $30 revenue minus $9 commission, minus $2.50 packaging, minus $10.50 food cost equals an $8.00 contribution. That is an $11.50 per order gap that must be covered by incremental volume, better pricing, or smarter routing to be worth it. Typical commission tiers published by the major platforms span 15% to 30%, so sensitivity testing is mandatory. In Canada, Uber’s 2026 update lists 20% Lite, 25% Plus (30% for Uber One orders), and 30% Premium for delivery, with pickup at 7% when in‑store pricing is validated. (cnbc.com, help.uber.com)
Now make it your own with a one‑line formula:
Delivery contribution per order = Ticket − (Commission% × Ticket) − Packaging − Food cost − Incremental labour.
Dine‑in contribution per order = Ticket − Food cost − Incremental labour tied to that order.
If you don’t have precise incremental labour yet, start with zero during off‑peak and a small per‑order estimate during peaks. Then sanity‑check with a one‑week pilot.
Here’s a compact step‑by‑step table you can copy. Replace the greyed numbers with yours.
| Line item | Dine‑in ($) | Aggregator Delivery ($) | Notes / Formula |
|---|---|---|---|
| Ticket (excl. GST/HST) | 30.00 | 30.00 | Keep apples to apples on pre‑tax revenue |
| Commission | 0.00 | 9.00 | 30% of ticket; test 15–30%: Ticket × Commission% |
| Packaging | 0.00 | 2.50 | Boxes, liners, condiments; include napkins/cutlery if used |
| Food cost | 10.50 | 10.50 | If delivery portions differ, adjust by 1–2 pts |
| Incremental labour | 0.00 | 0.00–1.00 | Add if extra expeditor/runner or overtime at peaks |
| Contribution | 19.50 | 8.00–7.00 | Dine‑in: 30 − 10.50 = 19.50; Delivery: 30 − 9 − 2.50 − 10.50 = 8.00 |
What does this mean for you? A 30% commission stack can take a 65% gross margin down to the high‑30s. Some operators try to mask it with higher delivery menu pricing. That may be viable if your brand holds price and guests accept a surcharge, but Canadian consumers have pushed back on hidden fees and confusing price builds. The Competition Bureau’s 2025 suit against DoorDash over alleged “drip pricing” should be a clear signal to make delivery pricing simple and transparent. (canada.ca)
Run a few more toggles:
- Commission 20% instead of 30% lifts delivery contribution by $3 per $30 ticket.
- Packaging sliding from $2.50 to $1.25 adds $1.25 back to contribution.
- Food cost engineered from 35% to 27% adds $2.40 to contribution on a $30 order.
💡 Pro Tip
When you test your numbers, run three scenarios (best, base, worst). Vary commission by plus or minus 3–7 percentage points and packaging by $1–$3. You’ll see your break‑even shift fast when commission and packaging move together.
Two practical anchors round this out. First, if your busiest two hours already max the kitchen, any delivery orders there likely replace higher‑margin dine‑in. It’s like sending two salespeople to pitch the same client; one will win and the other wasted a trip. Second, if weekdays from 2–5 p.m. are quiet, an engineered delivery SKU that hits under 28% food cost can convert idle time into contribution without adding staff. If you are comparing in‑house vs third‑party delivery, use the same contribution formula for each and make sure courier wages, insurance, and dispatch time are in the in‑house column.
If you’re still unsure about your competitive footing while you plug in numbers, skim this field guide on tracking competitor pricing and marketing and compare local delivery menus against your thresholds.
When delivery works, and when it destroys margin: rules of thumb based on the checklist and math
Delivery works when orders are incremental to your busy hours, when the kitchen has slack capacity, and when you design SKUs that travel well at low food cost. Think of delivery as a second storefront behind the kitchen pass. If that storefront opens during shoulder times and sells bundles with under‑28% food cost and a $20+ ticket, your per‑order contribution can survive aggregator fees. In 2025 and into early 2026, guests have kept a cautious posture on discretionary dining, so small indulgence formats win more than white‑tablecloth experiences on a random Tuesday. That tilt toward convenience and value has shown up in industry tracking and in platform trend summaries. (www150.statcan.gc.ca)
Delivery fails when it simply diverts guests out of your dining room, when the brand depends on ambiance and service, or when your line is already stretched. Across 80 Canadian restaurant SMBs analyzed via the Aurevon Intelligence Service, recurring threats included “platform disintermediation and delivery pressure” and “intense local competitive saturation.” Pair those with “low review volume limiting discovery,” and the result is obvious: if delivery replaces full‑price dine‑in while your online presence trails nearby rivals, contribution shrinks and new‑guest flow slows.
Translate that into three quick rules you can apply today:
- If peak‑hour seat or kitchen utilization tops 80%, restrict delivery during those windows or route it to pickup‑only. You’ll protect dine‑in contribution.
- Only send items that hit travel‑ready specs: food cost under ~28%, minimal texture loss at 20 minutes, and packaging that costs under $1.50 per order when bought at case rates.
- Demand real incrementality from marketplace exposure. If a tiered plan promises “feature” placement that costs 25–30% in commission, insist on a short pilot and measure whether those orders land outside your peak windows. Typical platform pricing in Canada uses tiered 15–30% structures, so you need your own evidence before you accept the drag. (cnbc.com)
Hybrid levers to tilt the economics: practical tactics before you sign
In practice, you don’t have to choose between all‑in or nothing. A handful of hybrid moves change the math fast.
Route‑to‑own with selective marketplace presence. Keep a marketplace listing for discovery and late‑night reach, but push persistent customers to your own ordering link by adding value they actually want: reliable pickup timing, small discounts, or exclusive bundles. This lowers your average commission rate. Operators who keep delivery discovery on apps but transact repeat orders directly tend to protect contribution while staying visible.
Ghost‑kitchen extension for delivery‑only SKUs. If your main brand depends on dine‑in experience, consider a delivery‑only sub‑brand with SKUs engineered to travel and hit sub‑28% food cost. This protects your core brand while meeting value‑seeking demand.
Pickup‑only with simple discounts. A 10% pickup discount drops price pressure for the guest and removes 15–30% commission for you. When labour headroom exists and curbside is easy to stage, this is often the fastest way to convert online attention into profit. DoorDash’s posted pickup commission in Canada is 8% on Plus and Premier and 10% on Basic, contingent on price parity with your in‑store menu. (merchants.doordash.com)
Menu engineering for delivery profitability. Redesign under‑30‑minute items to lock in margins: swap fragile fries for wedges that hold, adjust portion sizes, pre‑sauce judiciously, and tighten condiments. A small packaging rethink, like moving to case‑rate bowls that shave $1 off each order, adds real dollars back.
Integrate orders to cut errors and labour. Many Canadian operators route DoorDash, Uber Eats, and SkipTheDishes into the POS through Deliverect, which reduces double entry and misfires and helps the line keep pace during shoulder spikes. (deliverect.com, help.deliverect.com)
Before you push any of these live, define success with numbers. A short pilot with a targeted radius, off‑peak scheduling, and a fixed menu tells you more in 30 days than any sales deck. And if your competition keeps surprising you, shore up your situational awareness with a simple pass through how to identify your real competitors and refresh your competitor SWOT.
Answering owners’ top delivery questions
How do I know if delivery orders will be incremental or just cannibalize my dine‑in business?
Compare demand by hour and customer overlap. Pull POS reports for the past 8–12 weeks, mark utilization by hour, then overlay delivery timestamps during a small pilot. If delivery spikes when your room is half‑full and tickets come from postal codes with low reservation density, the orders are more likely incremental. If deliveries land on top of Friday peaks or your loyalty data shows regulars switching to delivery, expect cannibalization. Treat exclusives carefully and run a 30–60 day test with constrained delivery hours and a tight map so you can measure spillover before committing.
What minimum ticket size or food‑cost percentage makes delivery viable?
Aim above a $20 average ticket and engineer delivery‑focused SKUs with food costs under roughly 28%. Use the unit‑economics formula from the walkthrough and test three commission tiers and two packaging costs to find your break‑even. Smaller tickets can work if you pull orders through your own channel, bundle sides and drinks, or transition some delivery demand to pickup. Keep an eye on consumer sensitivity to fees and confusing pricing; federal enforcement actions around drip pricing show how quickly trust can erode if guests feel nickeled and dimed. (canada.ca)
Will offering delivery always require more labour or capital investment?
Not always. If the kitchen has slack capacity and you stage delivery tickets in shoulder hours, incremental labour per order is small. But if delivery crowds your peak or you need a dedicated expeditor, factor that into the per‑order contribution. Across 80 Canadian restaurant SMBs analyzed via the Aurevon Intelligence Service, labour scarcity and immigration constraints often limited service capacity and raised costs. The fix is process, then people: batch mise, pre‑label sauces, set a second make line during predictable bursts, and convert ad‑hoc overtime to scheduled shifts once demand stabilizes.
Should I sign exclusively with one aggregator or split across platforms?
Exclusivity can buy a lower headline commission, but it concentrates risk and reduces your negotiating leverage. Multi‑platform spreads risk but may lift your average commission and complicate ops. Use your model. Calculate contribution at each proposed rate and estimate the actual volume lift. If a single platform guarantees orders that keep your kitchen busy during off‑peak and frees headroom at peak, a short exclusive pilot may pencil out. Otherwise, push for non‑exclusive tiers with transparent, published fees. Recent industry notes show Canadian consumers are still value‑focused; locking yourself into a plan that depends on sustained pricing power is shakier in this environment. (bankofcanada.ca)
How much does Uber Eats charge restaurants in Canada?
As of March 11, 2026, Uber Eats lists standard packages at 20% for Lite, 25% for Plus (30% on Uber One member orders), and 30% for Premium on delivery. Pickup is 7% when your in‑store pricing is validated, otherwise 10%. Rates and eligibility can vary by city and plan, so check your merchant portal for the specifics. (help.uber.com)
Is it cheaper to do in‑house delivery?
It can be, but only if density and process are on your side. In‑house delivery avoids marketplace commissions and can convert idle labour into revenue, yet it adds wages, insurance, dispatch time, and driver management. If most orders are within a tight radius and you can average multiple drops per hour, in‑house may beat third‑party on cost. If not, shifting demand to pickup can be the simplest win on fees. For reference, DoorDash’s posted pickup commission in Canada is 8% on Plus and Premier and 10% on Basic with menu price parity, and Uber’s pickup marketplace fee is 7% with validated in‑store pricing. (merchants.doordash.com, help.uber.com)
What is a good profit margin for delivery?
Treat this as delivery profitability after variable costs. A practical target is to keep per‑order contribution at or above the low‑20s percent of ticket, for example $6–$8 contribution on a $30 order during off
Mitchell Ozmun
SMB Researcher, Business Analyst - Saskatchewan Born and Raised